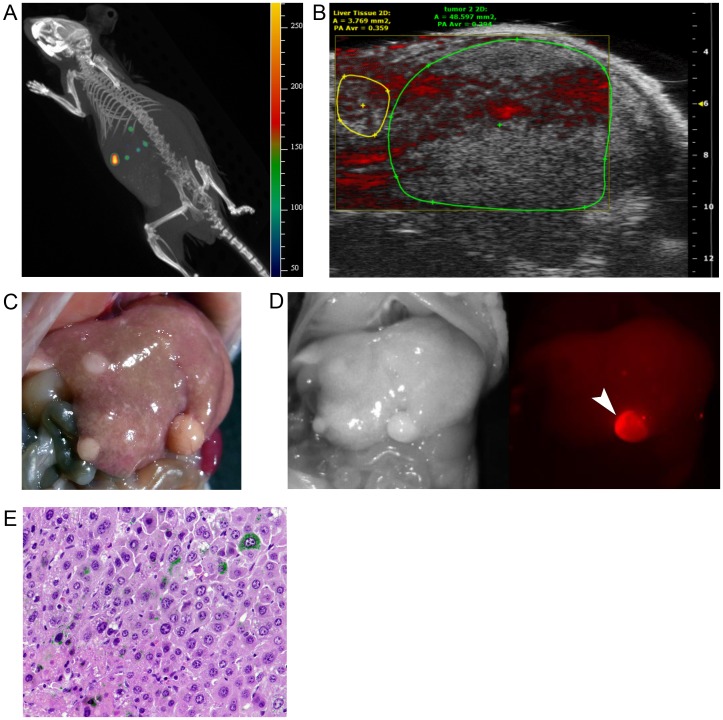
Figure 4. Photoacoustic tomography from the body surface in NASH-HCC model mice.
(A) Spectrum computed tomography of a living NASH-HCC model mouse identified hepatic tumors with accumulation of ICG that had been intravenously injected 48 hours prior (IVIS Spectrum CT, PerkinElmer, Hopkinton, US; excitation 745 nm, emission 800 nm). (B) Photoacoustic tomography failed to visualize any cancer-specific PA signals on US images. (C, D) Three liver nodules were macroscopically identified in this mouse (C); one was visualized on fluorescence imaging (D). (E) Fluorescence microscopy identified ICG fluorescence (demonstrated in green in this fusion image with hematoxylin-eosin staining) in the cytoplasm of some of the cancerous cells in this NASH-HCC model mouse.

