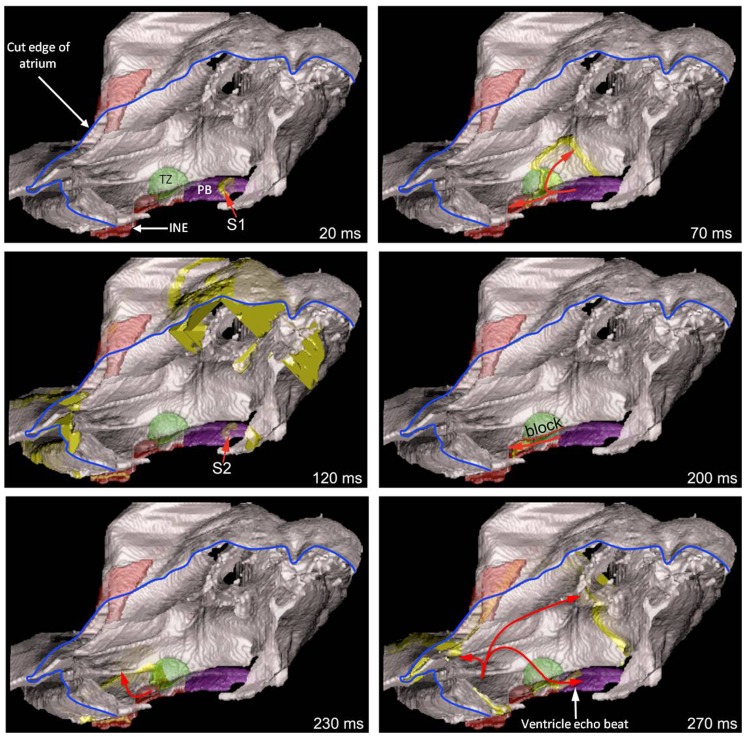
Figure 9. Simulation of a ventricular echo beat.
A right view of the model of the right atrium is shown with one face of the right atrium removed (the blue line shows the cut edge of the right atrium). Different segmented structures are shown in different colours. The panels show snapshots of activation after S1–S2 stimulation of the penetrating bundle. The thick yellow lines show the advancing wavefront of activation. The arrows show the direction of action potential conduction. 20 ms, retrograde conduction of the action potential along the penetrating bundle following S1 stimulation. 70 ms, retrograde conduction of the action potential along the fast (transitional zone; green) and slow (inferior nodal extension, red) pathways out of the AVN following S1 stimulation. 120 ms, retrograde conduction of the action potential along the penetrating bundle following S2 stimulation. Note the action potential following S1 stimulation has reached the outer parts of the right atrium. 200 ms, block of conduction along the fast pathway (line of block, red dotted line) and retrograde conduction along the slow pathway following S2 stimulation. 230 ms, retrograde conduction out of the slow pathway and into the right atrium following S2 stimulation. 270 ms, retrograde conduction throughout the right atrium and reentry into the AVN – the action potential conducted anterogradely through the transitional zone to the penetrating bundle. It is this action potential that would result in a ventricular echo beat. INE, inferior nodal extension; PB, penetrating bundle; TZ, transitional zone.

