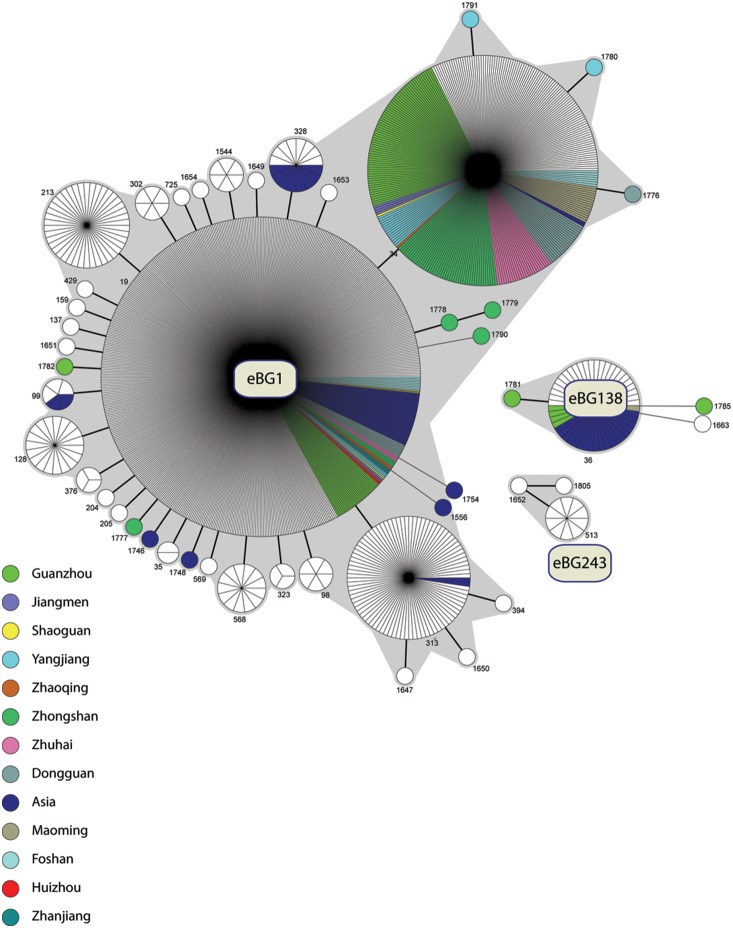
Figure 1. minimal spanning tree (MSTree) of the MLST data of S. enterica serovar Typhimurium.
Each circle corresponds to each STs with the size proportional to the number of isolates. The topological arrangement within the MSTree is dictated by its graphic algorithm, which uses an iterative network approach to identify sequential links of increasing distance beginning with central STs that contain the largest numbers of isolates. As a result, singleton STs are scattered throughout the MSTree proximal to the first node that was encountered with shared alleles, even if equal levels of identity to other nodes that are distant within the MSTree exist. The figure only shows the links of six identical gene fragments (SLVs, thick black line) and five identical gene fragments (DLVs, thin black line) because these correlate with eBGs, which are indicated by grey shading. The key shows the isolates from Guangdong or Asia.

