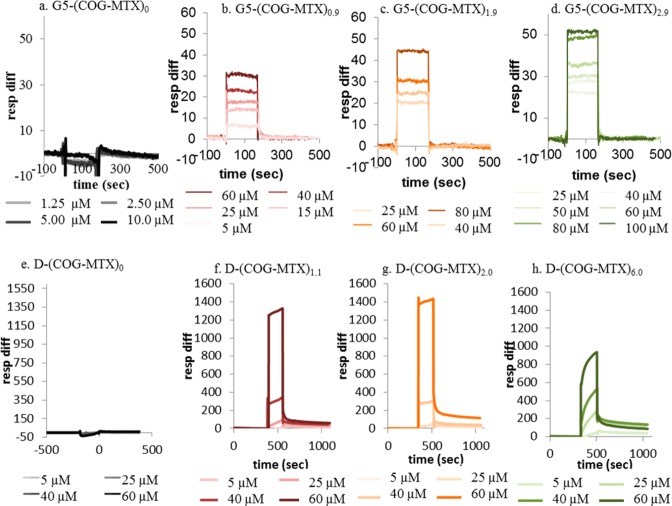
Figure 3.
SPR results of all click products. Color gradients represent least concentrated (light) to most concentrated (dark) injections. (a) G5 (acetylated control), (b) G5-(COG-MTX)0.9, (c) G5-(COG-MTX)1.9, (d) G5-(COG-MTX)2.9, (e) D (acetylated control), (f) D-(COG-MTX)1.1, (g) D-(COG-MTX)2.0, (h) D-(COG-MTX)6.0.

