
Figure 4.
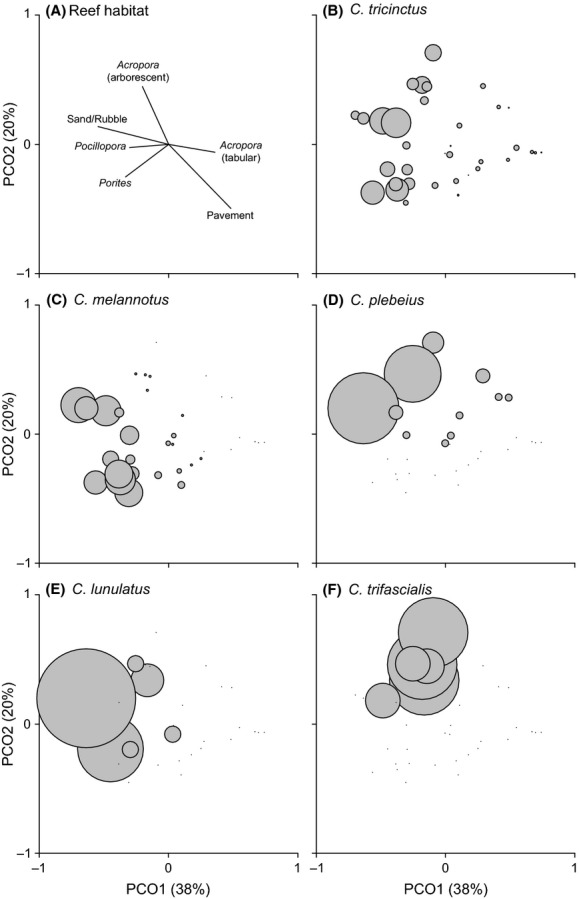
Optimized principal coordinate analysis (PCO) of spatial variation in Chaetodon abundance and composition across 36 transects at Lord Howe Island. (A) Reef habitat variables most correlated (Pearson’s correlation coefficient, r > 0.4) with the PCO axes. Bubble sizes indicate proportional abundance of (B) Chaetodon tricinctus, (C) Chaetodon melannotus, (D) Chaetodon plebeius, (E) Chaetodon lunulatus, and (F) Chaetodon trifascialis in areas characterized by tabular Acropora and/or pavement (indicated on panel A as transects toward bottom right quadrants of each panel), arborescent Acropora (top left quadrants) or Porites, Pocillopora and sand/rubble (bottom left quadrants).