
Figure 6.
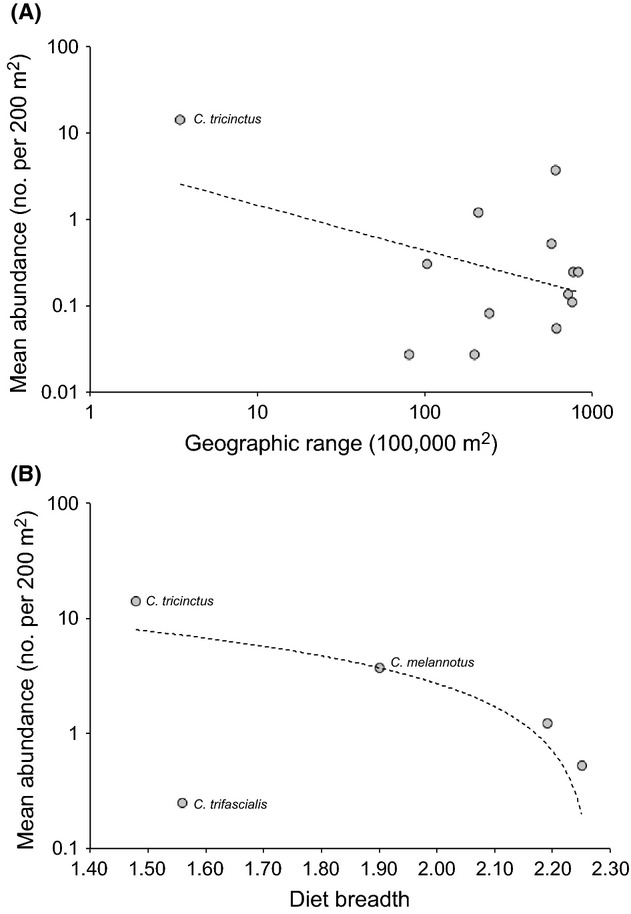
Correlations of (A) geographic range and (B) dietary breadth versus mean abundance (averaged across all sites) for Chaetodon butterflyfishes at Lord Howe Island. Abundance and geographic range are shown on a log-scale. Dietary breadth was estimated only for the five most abundant butterflyfishes at Lord Howe Island.