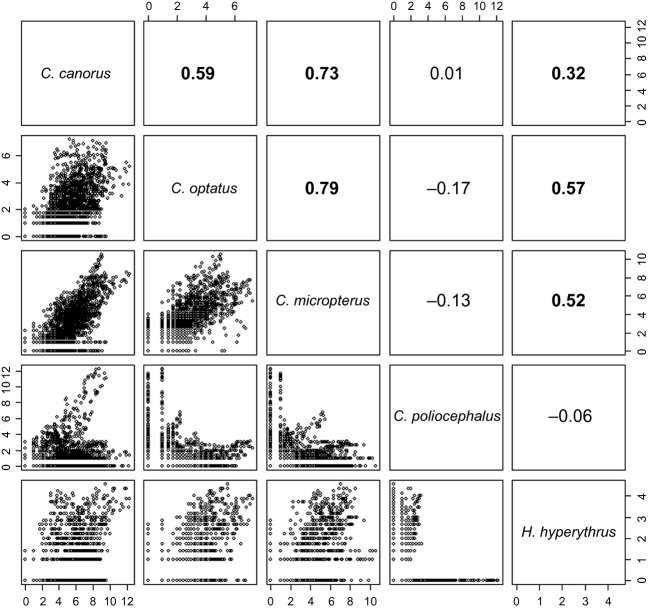
Figure 2.
The pairwise comparison of the relative occurrence between the species. The dots in the lower diagonal represent the square-rooted number of individuals observed in 5-min cells with circular neighborhood of 0.4 degree. The numbers in the upper diagonal represent the spearman rank correlation coefficients of the counterparts. Statistically significant relationships are in bold.

