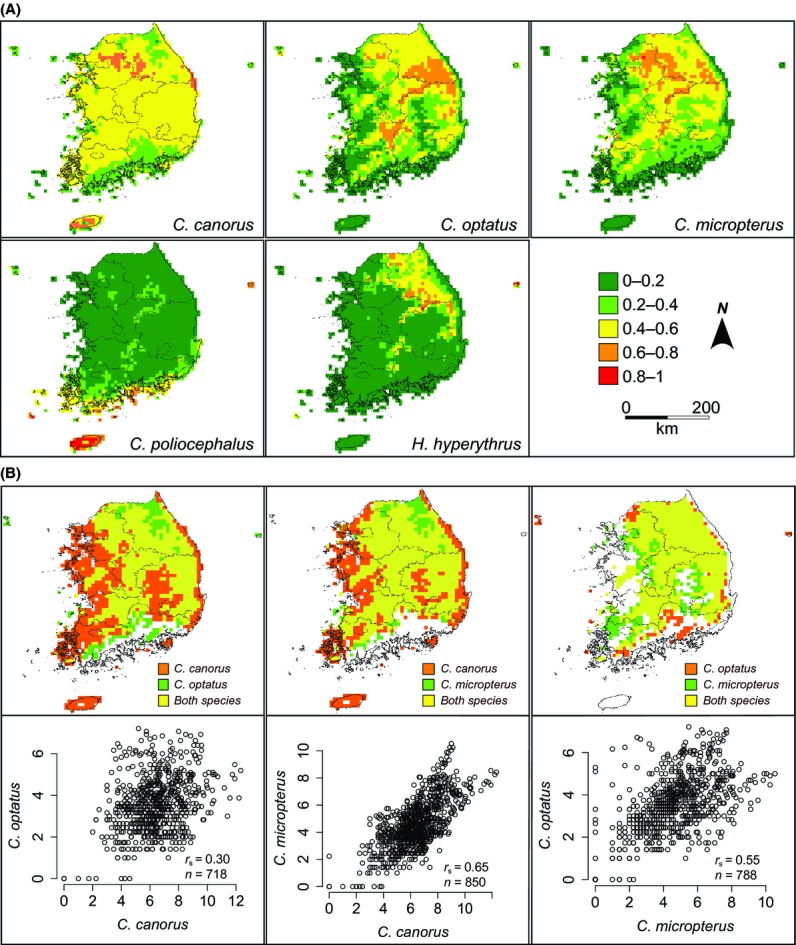
Figure 5.

(A) Spatial prediction of the five species of avian brood parasites breeding in South Korea. Different colors represent the different degrees of occurrence probability (or habitat suitability). (B) The upper panel illustrates the overlap between predicted distributions of the three most widely distributed species in a pairwise manner. From the left panel, C. canorus versus C. optatus, C. canorus versus C. micropterus, and C. optatus versus C. micropterus, respectively. The logistic threshold of ten percentile training presence was applied to generate the presence/absence map. The orange and green colors indicate the areas where only one species was predicted to be presence while the areas with yellow color represent that both species are likely to occur together. The lower panel shows the association between the observed numbers of individuals (square-rooted) of focal species in the predicted areas (yellow) where both species occur sympatrically. The observed number of individuals was obtained from 5-min cells applying the option of circular neighborhood of 0.4 degrees.
