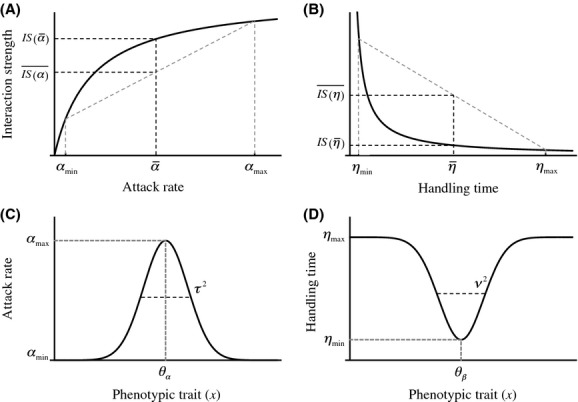
Figure 1.

(A), (B); Plots of the magnitude of the interaction strength against attack rate and handling time. Gray dashed curves represent mean interaction strength, not considering individual variation in attack rates or handling times. Solid curves represent interaction strengths considering variation in mean attack rate and handling times. If variation in attack rate only is considered, mean interaction strengths (dashed) are expected to be smaller than actual interaction strengths. If variation in handling time only is considered, mean interaction strengths (dashed) are expected to be greater actual interaction strengths. (C), (D); Plots of attack and handling time against a given quantitative phenotypic trait, where θα and θη are the optimal trait values for attack rate and handling time, respectively.
