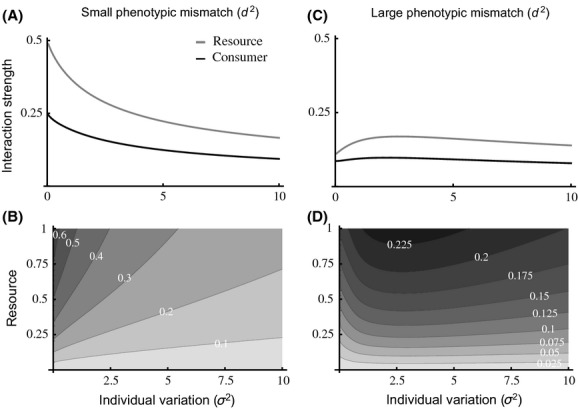
Figure 2.

(A), (D); Plots of interaction strength against individual variation (σ2) for consumers (black) and resources (gray). (B), (D); Contour plots of the interaction strength for varying resource levels against increasing individual variation (σ2). Small phenotypic mismatch: left column. Large phenotypic mismatch: right column. Parameter values: (A) αmax = 1, ηmax = 2, ηmin = 1, ε = 0.5, τ = 1, ν = 1, dα = 0, dη = 0, R = 1; (B) same as in (A) but R varies from 0 to 1; (C) same as in (a) but for dα = 2, dη = 2; (D) same as in (C) but R varies from 0 to 1.
