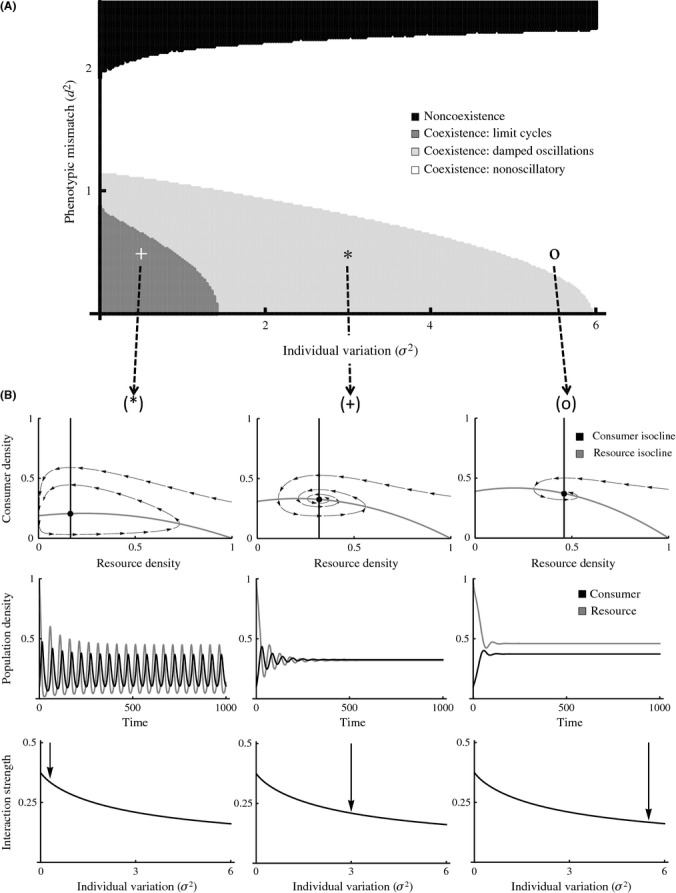
Figure 3.

(A) Outcome of the interaction plotted against individual variation and phenotypic mismatch. Consumers can go extinct but the resource survives (black), or both species can coexist (limit cycles in dark gray, damped oscillations light gray, nonoscillatory behavior in white). The asterisk, the cross, and the zero represent combinations of parameters we use as an example of how coexistence, stability, and interaction strengths change with variation. (B) First row: phase diagrams where the equilibrium occurs at the intersection the two isoclines (black: consumers, gray: resource, black dot: equilibrium). Arrows represent one possible trajectory of the system. Second row: dynamics for consumers (black) and resources (gray) through time. Third row: mean interaction strength in the system for both interacting species against individual variation. Parameter values: (a) r = 0.3, αmax = 2, ηmax = 2, ηmin = 1, ε = 0.5, τ = 1, ν = 1, K = 1, β = 0.1, dα = dη = 0.5 and σ2 = 0.3 (asterisk); dα = dη = 0.5 and σ2 = 3 (cross) and dα = dη = 0.5 and σ2 = 5.5 (zero).
