
Figure 3.
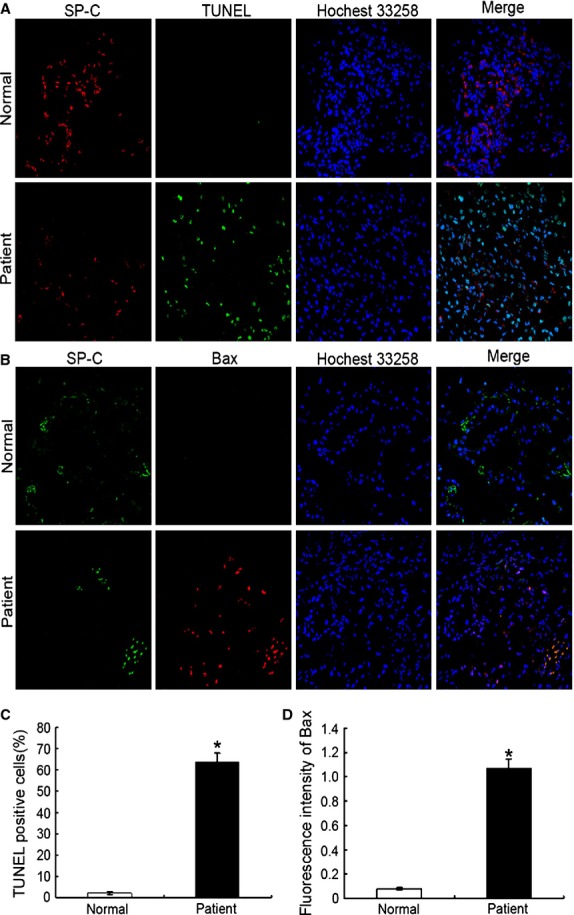
Apoptotic AECs-II observed in patient with lung fibrosis under a laser scanning confocal microscope. (A) Nuclear DNAs in the lung tissue of patient were observed using TUNEL. Condensation and fragmentation of nuclear DNA stained with FITC (green). The nuclei and SP-C were counterstained with Hoechst 33342 (blue) and SP-C antibodies (red), respectively. (B) Expression of bax in the lung tissue of patient. (C) TUNEL-positive cells increased in the lung tissue of patient. The TUNEL + SPC + cells and SPC+ cells in each whole image were counted in each whole image and bar graph represents the average value (TUNEL +SPC+ cells/SPC+ cells) from there independent experiments. (D) Expression of bax increased in the lung tissue of patient. The mean fluorescence intensity of Bax in each whole image was automatically quantified by Image-Pro Plus software and expressed in fluorescence units (FU) and bar graph represents the average value from there independent experiments; *P < 0.05.