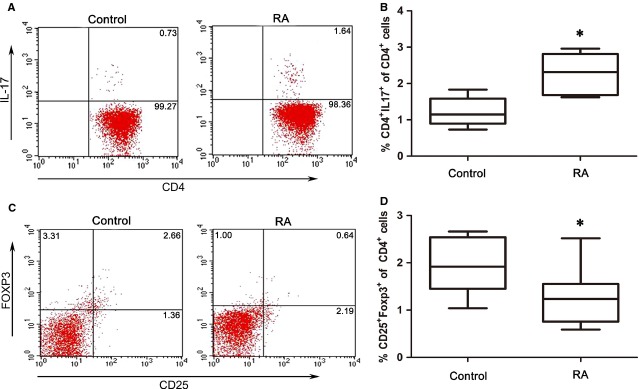
Figure 1.

Increased circulating CD3+CD4+IL-17+ Th17 cells and decreased CD4+CD25+Foxp3+ Treg cells in rheumatoid arthritis (RA) patients. (A) Peripheral blood mononuclear cells (PBMC) from RA patients (n = 25) and healthy controls (n = 20) were stimulated with PMA, ionomycin and BFA for 5 hrs, and then stained with fluorescently labelled anti-human antibodies. FCM analysis for CD3, CD4 and IL-17 was performed. The representative flow cytometric results are shown, and values indicate the percentage of events in the indicated quadrant. (B) Collective analysis of Th17 cells from RA patients and healthy controls; data are expressed as box plots. Each box represents the interquartile range (IQR). Lines inside the boxed represent the median. Whiskers represent the highest and lowest values. *P < 0.05, versus control (Mann–Whitney U-test). (C) PBMC from RA patients and healthy controls were stained with labelled anti-human antibodies. FCM analysis for CD4, CD25 and Foxp3 was performed. The representative flow cytometric results are shown, and values indicate the percentage of events in the indicated quadrant. (D) Collective analysis of Treg cells from RA patients and healthy controls, and the data are expressed as box plots. Each box represents the IQR. Lines inside the boxed represent the median. Whiskers represent the highest and lowest values. *P < 0.05, versus control (Mann–Whitney U-test).
