Figure 5.
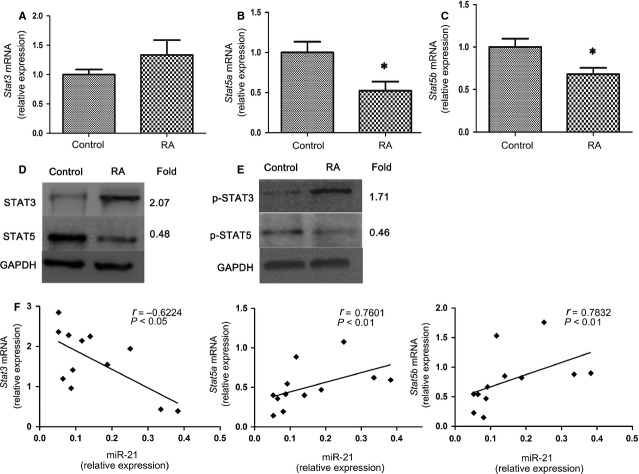
Increased expression and activation of STAT3, and decreased expression and activation of STAT5 in rheumatoid arthritis (RA) patients. (A) Total RNA from peripheral blood mononuclear cells (PBMC; 3 × 10⁶) in RA patients (n = 25) and healthy control (n = 20) were extracted. Real-time PCR analysis of the expression of Stat3 (A), Stat5a (B), Stat5b (C) in patients with RA and healthy controls. The expression of these genes in patients with RA is shown as relative levels compared with healthy controls. Data are expressed as the mean ± SEM. *P < 0.05, versus control (Student’s t-test). (D) Total protein from PBMC (3 × 10⁶) in RA patients (n = 3) and healthy control (n = 3) was extracted. STAT3 and STAT5 protein expression was measured by Western blotting. (E) PBMC (3 × 10⁶) from RA patients (n = 3) and healthy control (n = 3) were stimulated with lipopolysaccharide (LPS) (200 ng/ml) for 24 hrs then extracted for total protein. p-STAT3 (Tyr705) and p-STAT5 (Tyr694) were measured by Western blotting. GAPDH was used as a loading control. The intensity of each band was analyzed using LANE-1D software (Beijing Sage Creation Science, China), and the ratio of the RA group to the control group for each item is presented as fold difference. Data are representative of three independent experiments. (F) Correlation of miR-21 expression with that of Stat3, Stat5a and Stat5b mRNA in PBMC of RA patients (n = 12). Statistical analysis was performed with Spearman correlation and P < 0.05 was considered to be significant.

