
Figure 4.
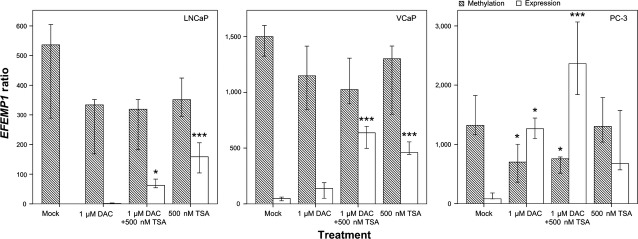
EFEMP1 promoter methylation and mRNA expression levels in prostate cancer cell lines (LNCaP, VCaP, PC-3) after pharmacological treatment with 5-aza-2′deoxycytidine alone (1 μM DAC), in combination with trichostatin A (1 μM DAC+ 500 nM TSA) or with trichostatin A alone (500 nM TSA). Error bars represent mean ± SD of 3 biological replicates. Statistically significant differences between the Mock and treatment groups are denoted as: *P < 0.05; **P < 0.01; ***P < 0.001.