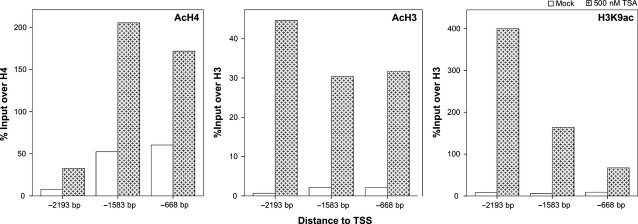
Figure 5.

Quantitative ChIP-PCR analysis of post-translational histone modifications (PTMs) associated with transcriptional activation (AcH4, AcH3, H3K9ac). There is an enrichment in three different regions upstream of EFEMP1 transcriptional start site (TSS) in LNCaP cell line upon treatment with trichostatin A (TSA, 500 nM). Positive and negative ChIP-controls (RNA polymerase 2 and IgG respectively) are not depicted. Results are represented as percentage of input over control (H4 or H3, accordingly).
