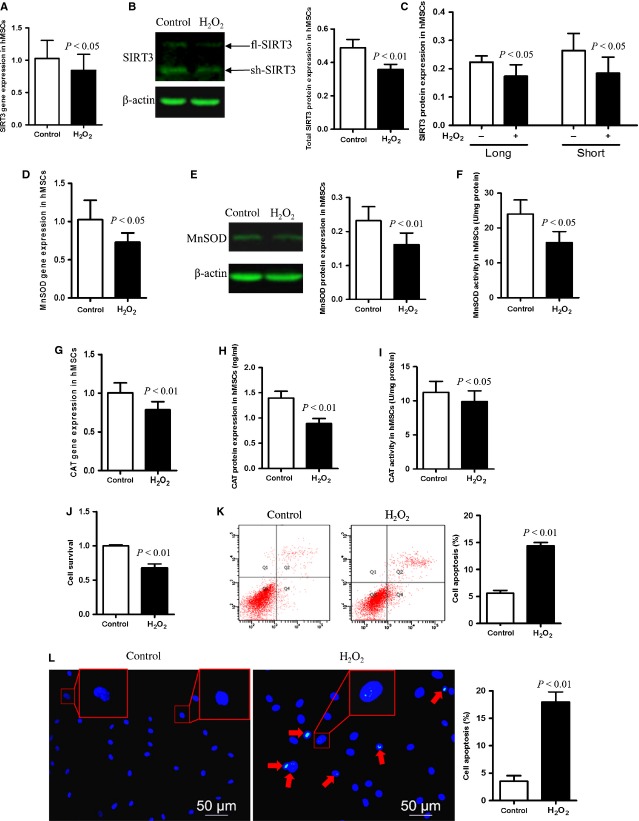
Figure 1.
Oxidative stress leads to decreased SIRT3, CAT and MnSOD levels in young hMSCs correlated with decreased cell survival and increased apoptosis. (A) hMSCs was treated with 1 mM H2O2 for 1 hr and gene expression was evaluated by real-time PCR. SIRT3 mRNA expression was reduced in young hMSCs under oxidative stress. (B and C) show total SIRT3 protein expression levels as well as the expression levels of its two isoforms (full-length SIRT3, fl-SIRT3 and short SIRT3, sh-SIRT3) before and after H2O2 treatment, assessed by Western blot with β-actin serving as an internal control. (D and G) show MnSOD and CAT gene expression before and after treatment. (E and H) MnSOD and CAT protein expression assayed by Western blot. (F and I) Enzymatic activity of MnSOD and CAT in control and H2O2-treated groups. (J) Cell survival evaluated by Cell Counting Kit-8 (CCK8). (K and L) Cell apoptosis assessed by flow cytometry and 4′,6-diamidino-2-phenylindole (DAPI) staining in control and H2O2-treated groups. Red arrows indicate apoptotic cells and some cells are enlarged to show the stages of apoptotic degradation: the nuclear membrane edge of phase I apoptotic cells is rippled (left panel, insets), while the chromatin of phase II apoptotic is highly condensed and marginalized (right panel, red arrows and inset), and finally apoptotic bodies are formed.

