
Figure 7.
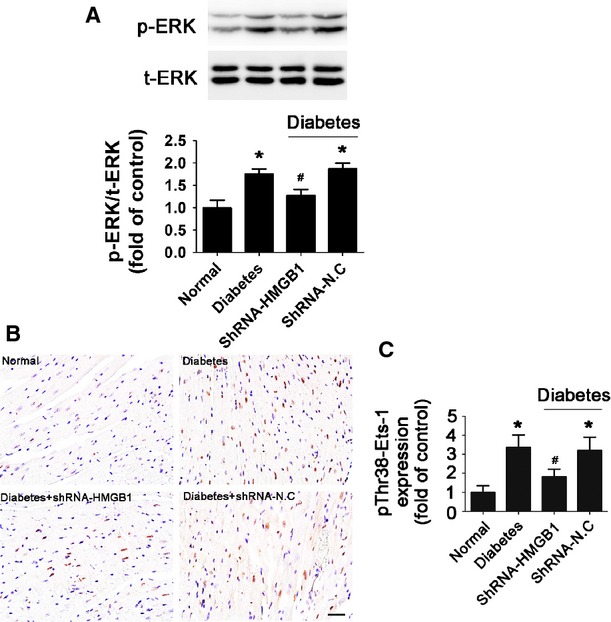
Inhibition of HMGB1 reduced hyperglycaemia-induced phosphorylation of ERK and Ets-1 in vivo. (A) Western blot analysis of the expression of total-ERK (t-ERK) and phospho-ERK (p-ERK) in mice. (B and C) Immunohistochemical staining and quantification of pThr38-Ets-1 (scale bar: 20 μm). Data are mean ± SD (n = 8). *P < 0.05 compared with normal; #P < 0.05 compared with diabetes or diabetes+shRNA-N.C.