Figure 7.


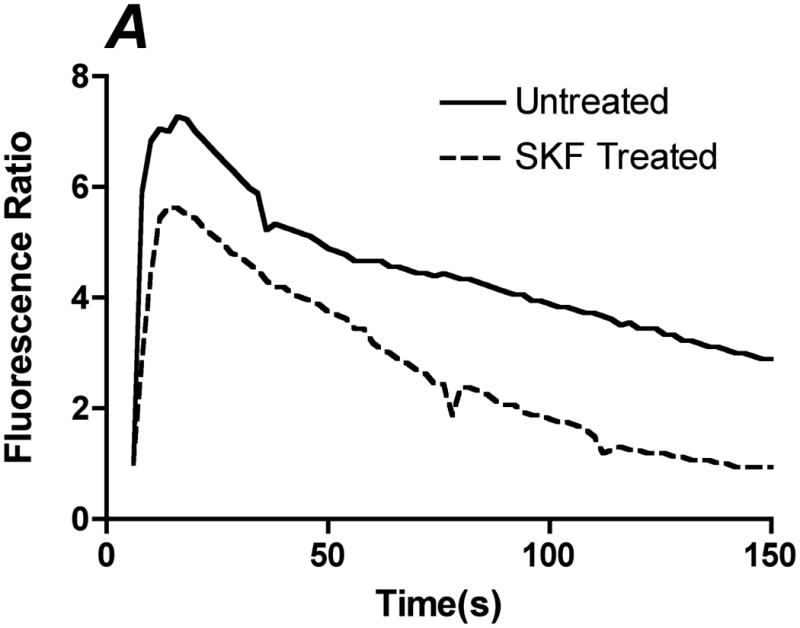
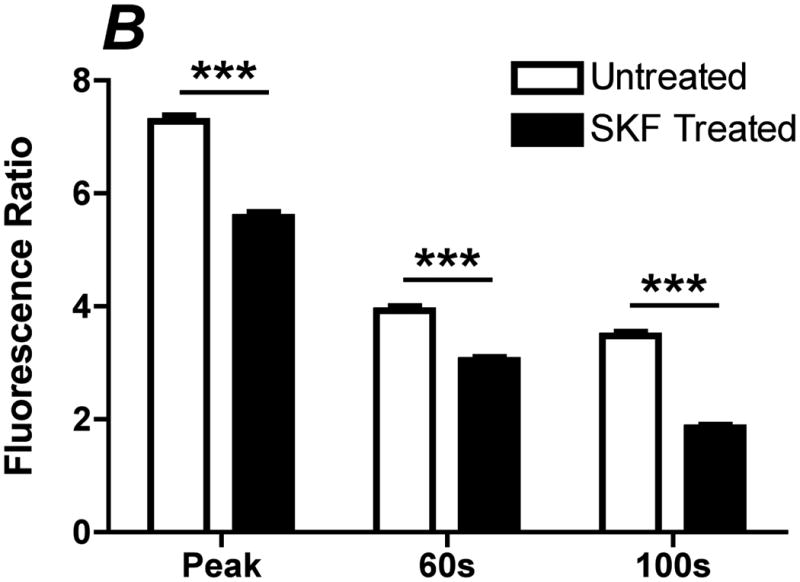
Inhibition of ATP-induced CCE by SKF-96365. Prior to the experiment, cells were incubated with PBS with Ca+2 or 50 μM of SOC inhibitor SKF-96365 for 10 min. A. Representative traces of the calcium response in untreated (solid line) and SKF (dotted line) treated cells to 500 μL of 100 μM ATP with calcium. B. Bar graph representing average responses for each condition at the peak response, 60s and 100s. SKF reduced transient and sustained calcium response, which was statically significant from untreated and SKF treated cells. Average responses represent multiple coverslips (cs) and total cell count among coverslips (n) Untreated: #cs= 8, n=512; SKF: #cs=5, n=298. (Mean and SEM, Two-tailed t-test p<0.0001)
