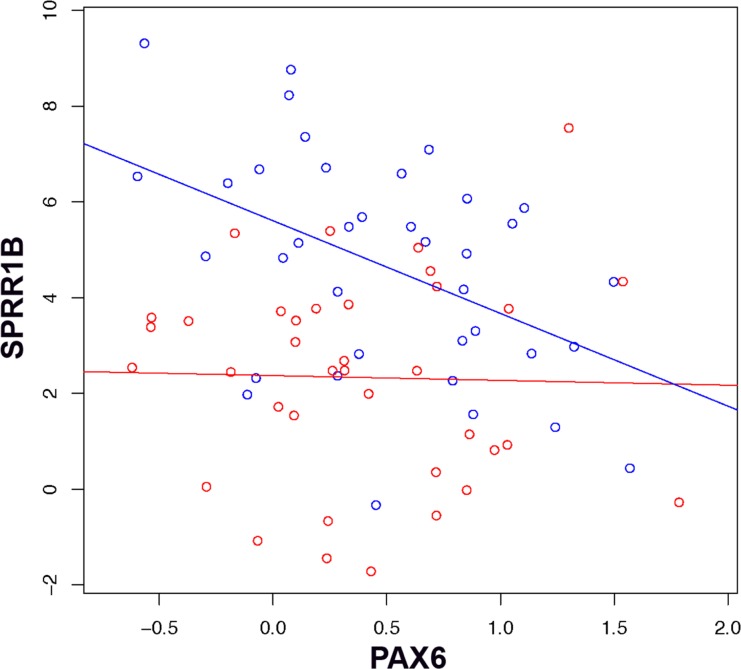
Figure 2.
Scatterplot of SPRR1B (vertical axis) versus PAX6 ΔCT (horizontal axis). Points below the median IL-1 ΔCT (high expression of IL-1β) are represented in blue; points above the median (low expression of IL-1β) in red. The regression line of SPRR1B versus PAX6 for each group is indicated by a blue or red line.

