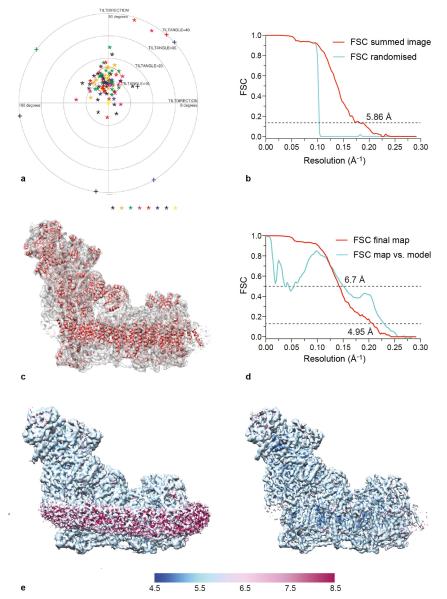
Extended Data Fig. 2. Validation of the map and resolution.
a) Tilt-pair analysis45 of complex I in cymal-7. 100 complex I particles from eight image pairs, recorded with a relative tilt angle of 10°, were extracted and subjected to tilt-pair analysis with FREALIGN42. The outer radius of the plot is 40° and the orange circle centered at the expected tilt angle has a radius of 6°. b) Phase randomisation to check for overfitting. Phases that are beyond 10 Å in each of the micrographs used in the final data set (frames 1-32) were randomised, and then refinement was performed as for a normal data set (FSC summed image corresponding to frames 1-32). As expected, the graph shows a drop in the Fourier shell correlation (FSC) curve at 10 Å, validating the presence of information beyond 10 Å in the images. Note that the use of gold-standard refinement procedures in RELION14 prevents any overfitting, and this test was done only as an additional control. c) An overview of the final map and the model built into it. d) FSC curves of the final map and of the model versus the map. The curve in red is the gold-standard FSC of the final map (after classification) and the resolution at FSC = 0.143 is ~4.95 Å. The curve in cyan is the FSC between the final map and the model, and at FSC = 0.5 the resolution is 6.7 Å. Note that the present model is not complete since it is only a polyalanine model without any side chains, and loop regions in a number of subunits have not been modelled. e) The final map of mammalian complex I was analysed with ResMap49. The left-hand panel (with lower density threshold) shows that the detergent/phospholipid belt is of lower resolution, and the protein regions of the map show resolution distributed from 5 to 6 Å. In the right-hand panel the map is shown at higher density threshold, so the detergent/phospholipid belt is not visualised. Some of the interior parts of the map have resolution of 4.8-5 Å.

