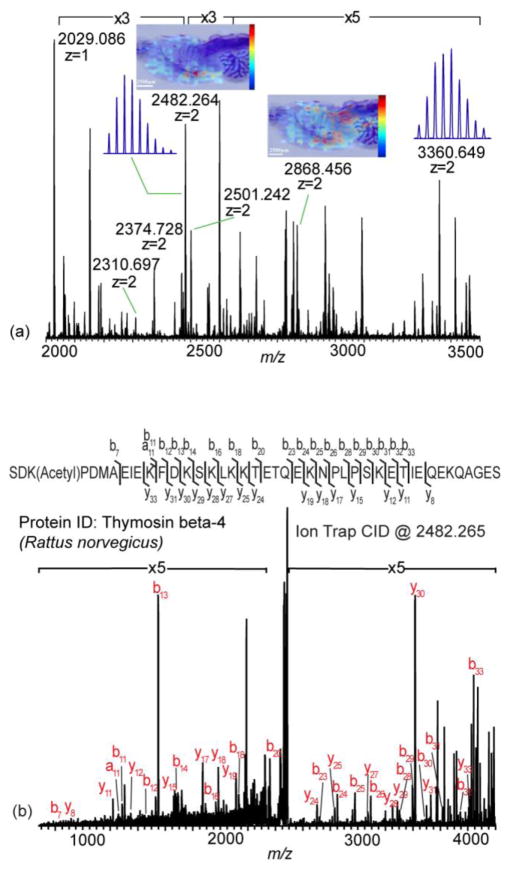
Figure 3.
Multiply charged MALDI MS tissue profiling and imaging analysis. Full MS profiling, MS/MS and MS imaging analyses on rat brain tissue sections were performed with the optimized condition. (a) Full MS profiling and imaging analyses on rat brain tissue section. Multiply charged ions were detected. Spatial distributions of doubly charged signals at m/z 2482.264 and m/z 2868.456 were mapped by MS imaging. (b) CID MS/MS analysis at m/z 2482.265. This protein was identified to be thymosin beta-4 (Rattus norvegicus).

