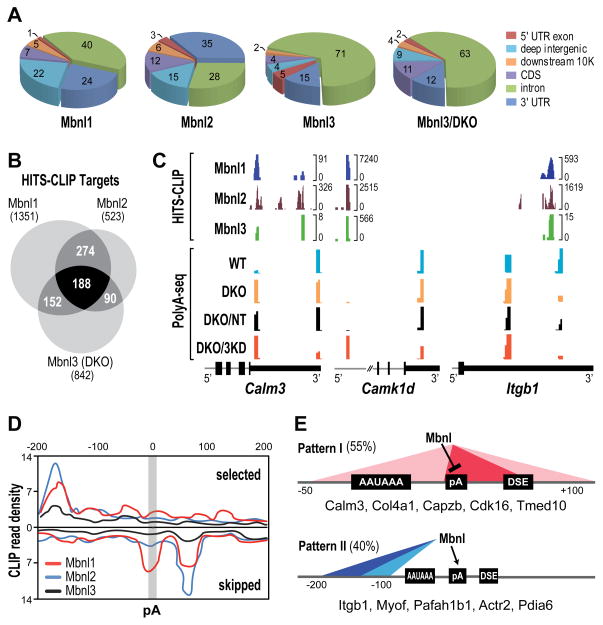
Figure 2. Mbnl Binding Sites and Alternative Polyadenylation.
(A) Pie charts showing genomic distributions of binding sites for Mbnl1, Mbnl2 and Mbnl3 in WT MEFs and Mbnl3 in Mbnl1/2 KO (Mbnl3/DKO) MEFs.
(B) Venn diagram of genes that contain Mbnl binding sites (HITS-CLIP targets) showing overlap of genes that are regulated by Mbnl1-3 in MEFs.
(C) Wiggle plots of HITS-CLIP (top) and PolyA-seq (bottom) highlight Mbnl binding sites that overlap and flank affected pAs in MEFs for 3′ UTRs (Calm3, Itgb1) and introns (Camk1d). For Mbnl3 HITS-CLIP, DKO MEFs were used since loss of Mbnl1 and Mbnl2 led to an increase in Mbnl3 binding to Mbnl targets. HITS-CLIP brackets indicate the number of unique tags at each site. PolyA-seq analysis was performed on WT (turquoise), DKO (orange), DKO treated with non-targeting siRNAs (DKO/NT, black) and DKO treated with Mbnl3 siRNAs (DKO/3KD, red) MEFs.
(D) Mbnl polyadenylation regulatory map showing Mbnl CLIP tag density ± 200bp from the cleavage site and CLIP read density (x103).
(E) Two major functional patterns for Mbnl proteins in alternative polyadenylation.

