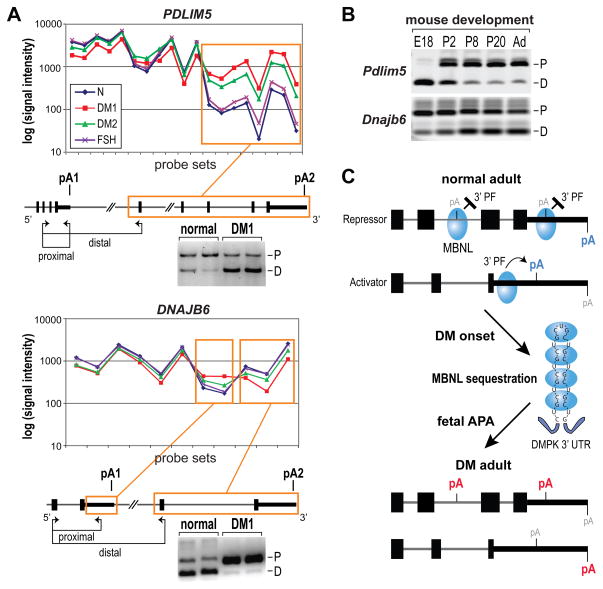
Figure 7. AllExon Microarray Analysis of APA in DM1 and DM2 muscle.
(A) AllExon array hybridization results for probe sets representing PDLIM5 (top) and DNAJB6 (bottom) for muscle isolated from healthy individuals (blue line, N), DM1 (red), DM2 (green) and FSHD (FSH, violet) patients. Probe sets showing significant differences for both DM1 vs N and DM2 vs N comparisons are indicated by orange frames. Positions of differentially expressed RNA regions are marked on gene maps with experimentally confirmed polyA sites indicated (pA1, pA2; black box, coding region; thick black line, 3′ UTR; thin line, introns). The positions of RT-PCR primers (proximal, distal) are shown by arrows below each gene structure. Also shown are APA-specific RT-PCR gels that confirmed the transition from proximal (P) to distal (D) for PDLIM5, and from distal to proximal for DNAJB6, polyA sites in DM1 versus normal adult muscle.
(B) Both Pdlim5 and Dnajb6 showed pA shifts during mouse muscle development from embryonic day (E)18, postnatal days P2, P8 and P20 to adult (Ad) mice. Note the fetal (E18) and neonatal (P2) patterns are similar to DM1.
(C) Model for MBNL control of alternative polyadenylation. When MBNL protein (blue ovals) binding sites overlap a polyA site, they repress recruitment of 3′ end processing factors (3′ PF) while binding primarily upstream activates 3′ end processing at the downstream site. Depletion of MBNL activity due to sequestration by CUGexp RNAs results in aberrant activation of polyA sites normally expressed during embryogenesis (red pA) and silencing of adult polyA sites (blue pA).

