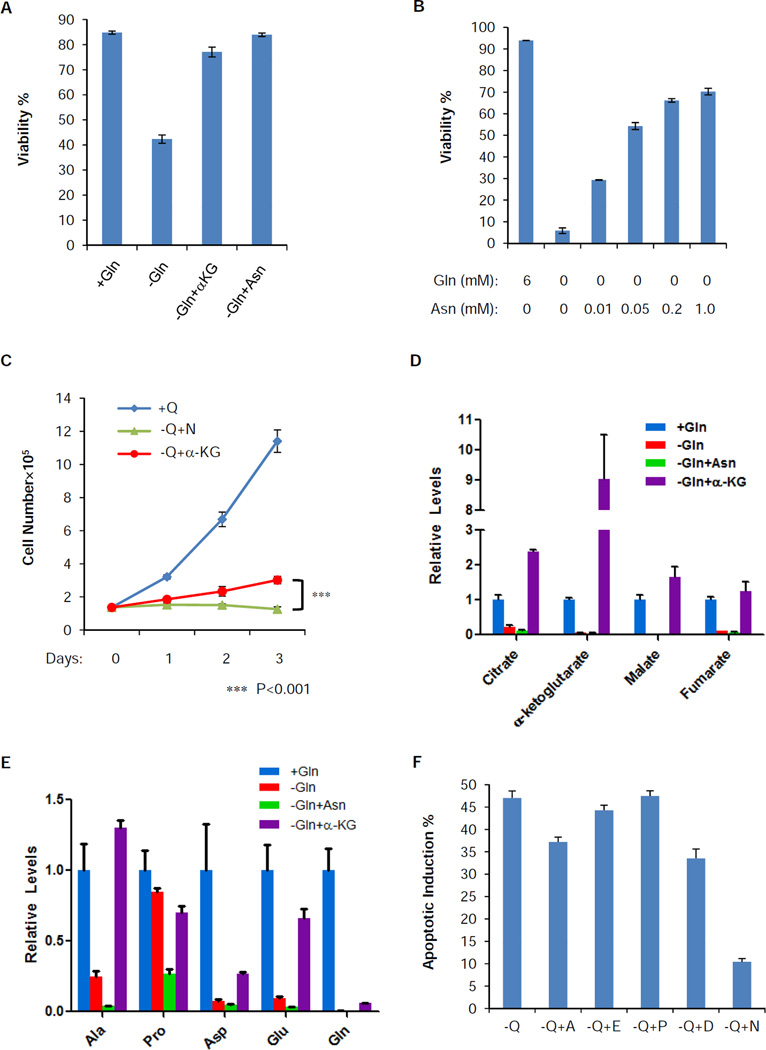
Figure 5. Extracellular asparagine completely restores the viability, but not the TCA cycle intermediates, other nonessential amino acids or proliferation, in the absence of glutamine.
(A) SF188 cells were cultured in DMEM with the following modification: +Gln, −Gln, −Gln+αKG (5 mM) and -Gln+Asn (4 mM) for 48 hours. Viability was measured by Annexin V and PI staining. Data are shown as mean +/− S.D., n=3.
(B) SF188 cells were cultured in DMEM without glutamine in the presence of various concentrations of asparagine for 4 days. Viability was measured by Annexin V and PI staining. Data are shown as mean +/− S.D., n=3.
(C) SF188 cells were grown in DMEM with the following modification: +Q, −Q+N (4 mM) and −Q+αKG (5 mM) for 3 days and cell number was recorded. Data are shown as mean +/− S.D., n=3. The p-value was determined by using Student’s 2 tailed t-test.
(D) SF188 cells were cultured in the same conditions as panel (A) for 16 hours. Intracellular citrate, α-ketoglutarate, malate and fumarate were quantified by GC-MS and normalized to cellular protein content. Data are shown as mean + S.D., n=3.
(E) SF188 cells were cultured in the same conditions as panel (A) for 16 hours. Intracellular levels of alanine (Ala), proline (Pro), aspartate (Asp), glutamate (Glu) and glutamine (Gln) were quantified by LC-MS and normalized to total cell volume. Data are shown as mean + S.D., n=3.
(F) SF188 cells were cultured in DMEM in the absence of glutamine (−Q), individually supplemented with 0.2 mM alanine (−Q+A), glutamate (−Q+E), proline (−Q+P), aspartate (−Q+D), or asparagine (−Q+N). Apoptotic induction percentage was defined by Annexin V positive staining 2 days post medium change and then subtracted by the basal level (cells grown in complete DMEM with glutamine) of apoptotic rates. Data are shown as mean + S.D., n=3.
See also Figure S4.

