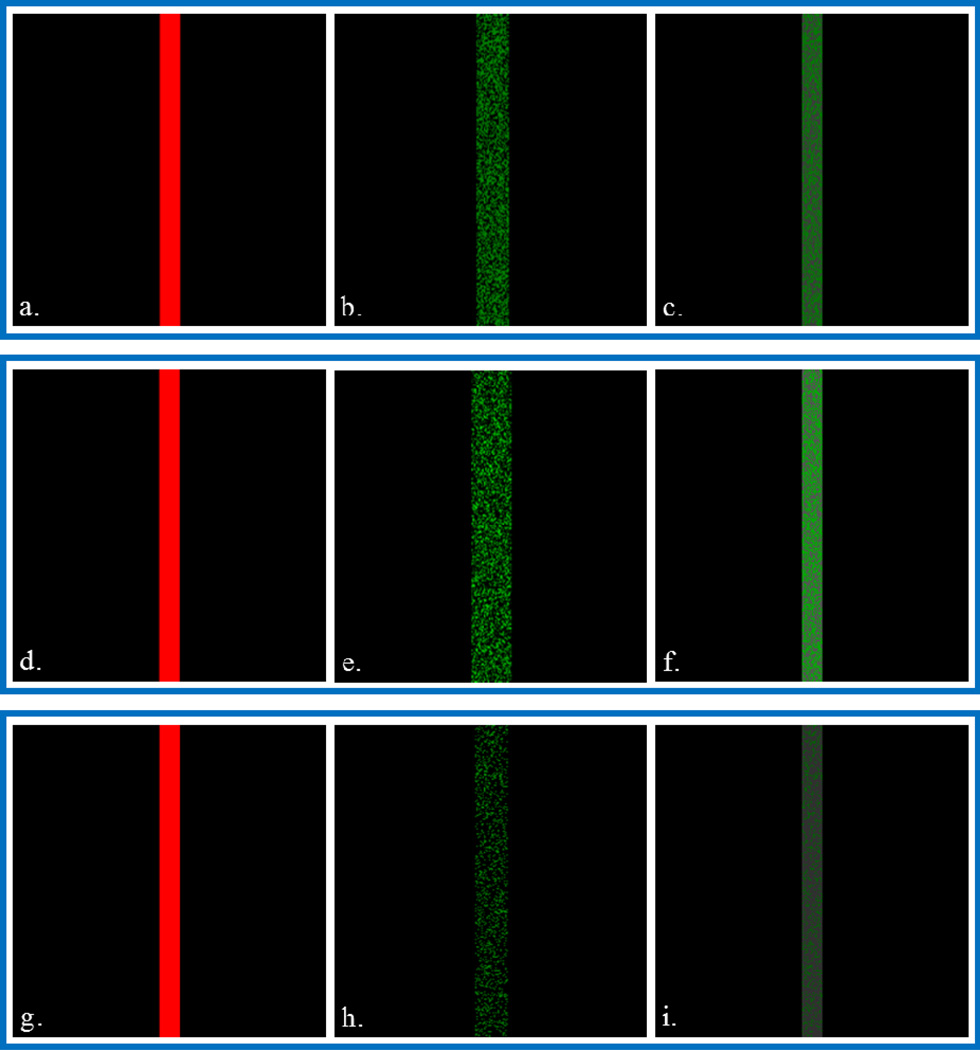
Figure 1.
Left column is simulated SEM images (512 × 512 pixels, solid line is 32 pixels wide), middle column is simulated SIMS images (256 × 256 pixels), and right column is the corresponding fused image (512 × 512 pixels). For the SIMS images: (b) line is 50% fill, 26 pixels wide; (e) line is 50% fill, intensity of filled pixels is 1–100, 32 pixels wide; (h) line is 20% fill, 26 pixels wide. All pixel values are given with respect to the image’s resolution (512 or 256 pixels).

