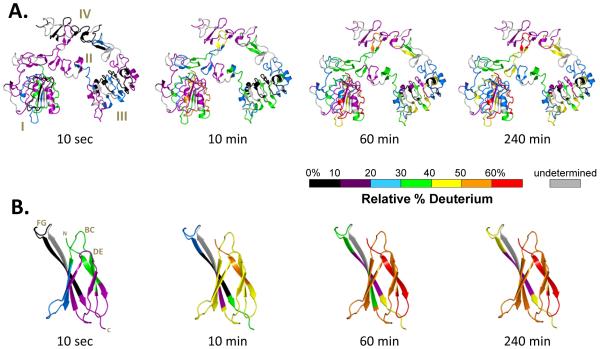
Figure 1.
Summary of all HDX MS data for (A) extracellular EGFR (exEGFR) free in solution and (B) Adnectin 1 free in solution. The HDX MS data are not corrected for back-exchange (see Methods) and are therefore reported as relative. PDB entry 3QWQ [19] was colored using the color code indicated for the deuteration times shown at the bottom of each image.

