Figure 5.
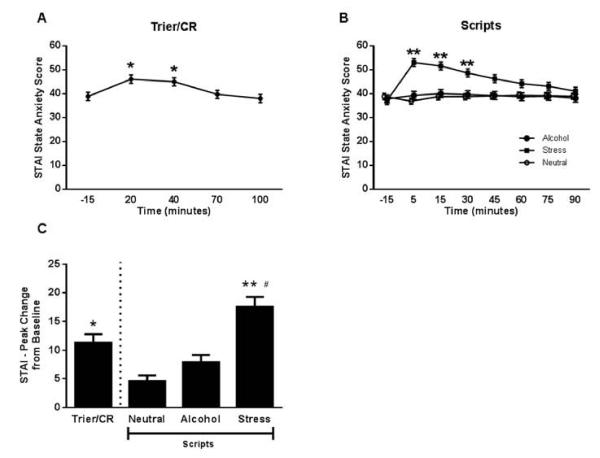
Anxiety response to the Trier/CR and scripts.
(A) Time course of the anxiety response during the Trier/CR (* = different from −15, 70, and 100 minutes; Tukey HSD p < 0.05). Model covariates included gender, treatment, age, CTQ score, and neuroticism score (n = 50 due to missing data for some of the covariates). (B) Time course of the anxiety response during the Scripts (** = stress different from both alcohol and neutral; Tukey HSD p < 0.05). Model covariates included gender, treatment, age, ADS score, and neuroticism score (n = 50 due to missing data for some of the covariates). (C) Comparison of peak change from baseline anxiety between the Trier/CR and Scripts (** = different from both alcohol and neutral script, * = different from neutral script, # = different from Trier/CR; Tukey HSD p < 0.05). Model covariates included gender, treatment, and CTQ score (n = 52). Error bars denote SEM.

