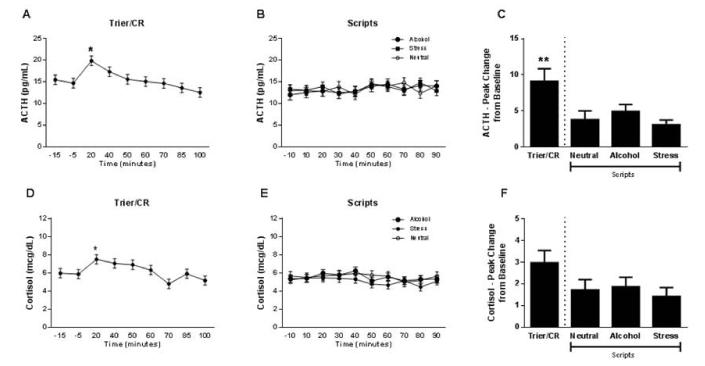
Figure 6.
Neuroendocrine response to the Trier/CR and scripts.
(A) Time course of the ACTH response during the Trier/CR (* = different from −15, −5, 50, 60, 70, 85 and 100 minutes; Tukey HSD p < 0.05). Model covariates included gender, treatment, and number of heavy drinking days (n = 48 due to missing data for ACTH). (B) Time course of the ACTH response during the Scripts. Model covariates included gender, treatment, age, number of heavy drinking days, and neuroticism score (n = 43 due to missing data for ACTH and for some of the covariates). (C) Comparison of peak change from baseline ACTH between the Trier/CR and Scripts (** = different from both neutral and stress script; Tukey HSD p < 0.05). Model covariates included gender, treatment and age (n = 34 due to missing data for some ACTH measurements that precluded calculation of peak change from baseline for all subjects). (D) Time course of the cortisol response during the Trier/CR (* = different from 70 and 100 minutes; Tukey HSD p < 0.05). Model covariates included gender, treatment, race ADS score, and neuroticism score (n = 46 due to missing data for some of the covariates). (E) Time course of the cortisol response during the Scripts. Model covariates included gender, treatment race, ADS score, and total score on the ASI (n = 43 due to missing data for some of the covariates). (F) Comparison of peak change from baseline cortisol between the Trier/CR and Scripts. Model covariates included gender, treatment, CTQ score, and the total score from the ASI (n = 31 due to missing data for some of the covariates and for some cortisol measurements that precluded calculation of peak change from baseline for all subjects). Error bars denote SEM.

