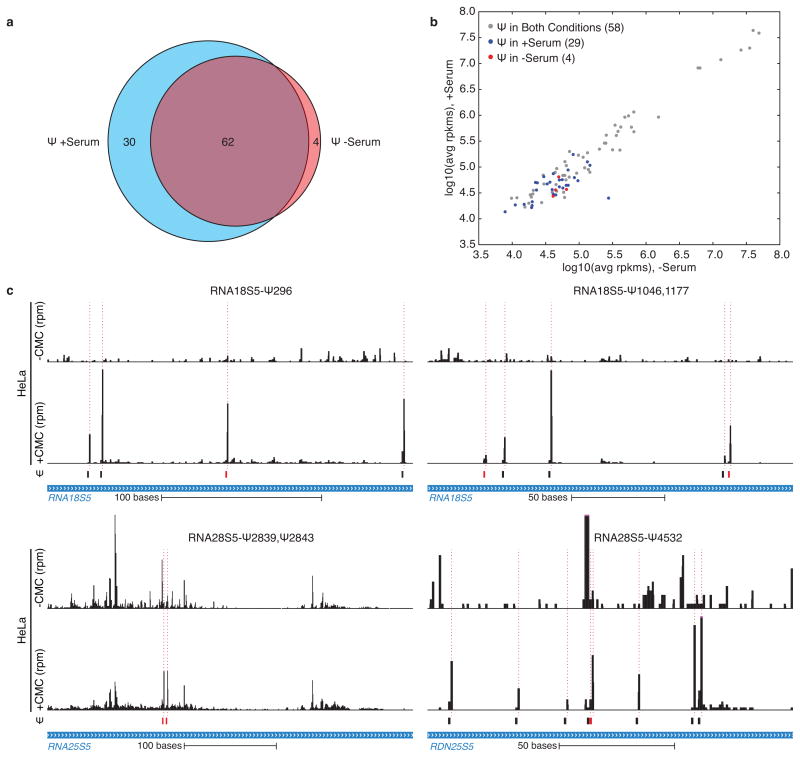
Extended Data Figure 10. New pseudouridines in human RNAs.
a) A Venn diagram showing the overlap of mRNA pseudouridiylation events between plus serum and serum starved HeLa cells. b) A plot of log-transformed average rpkms in serum-starved versus serum-fed HeLa for all coding genes with a Ψ identified by Pseudo-seq. All genes (gray), genes with a Ψ induced in plus serum cells (blue), and genes with a Ψ induced in serum-starved cells (red) are indicated. c) Pseudo-seq reads for RDN18S5 (184–411) (top, left), RDN18S5 (1015–1210) (top, right), RDN28S5 (2713–3108) (bottom, left), and RDN28S5 (4461–4618) (bottom, right). CMC-dependent peaks of reads are indicated with dashed red lines, and highlighted Ψs are indicated by red boxes. Traces are representative of n=4 biological replicates.

