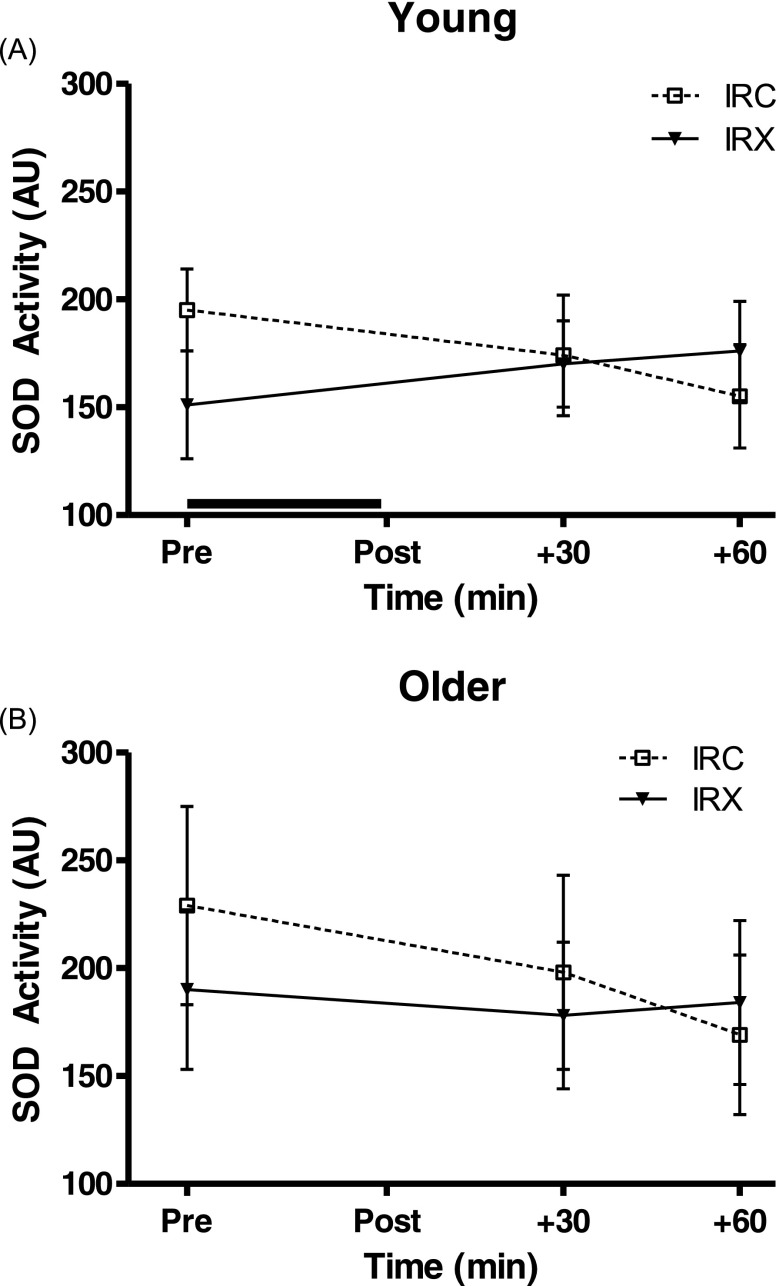
Fig. 3.
Superoxide dismutase (SOD) activity responses during the first hour of the I/R trial with preceding exercise (IRX; black triangles, solid line) and the control I/R trial (IRC; open squares, dotted line) in the young (a; n = 8) and older (b; n = 9) groups. Values are means ± SEM. The black line above the x-axis denotes the time of forearm ischemia/reperfusion. There were no significant main effects or interaction effect between time and trial in either group

