

Abstract
Tools that are capable of manipulating micro-sized objects have been widely used in such fields as physics, chemistry, biology, and medicine. Several devices, including optical tweezers, atomic force microscope, micro-pipette aspirator, and standing surface wave type acoustic tweezers have been studied to satisfy this need. However, none of them has been demonstrated to be suitable for in vivo and clinical studies. Single beam acoustic tweezers (SBAT) is a technology that uses highly focused acoustic beam to trap particles toward the beam focus. Its feasibility was first theoretically and experimentally demonstrated by Lee and Shung several years ago. Since then, much effort has been devoted to improving this technology. At present, the tool is capable of trapping a microparticle as small as 1 μm, as well as a single red blood cell. Although in comparing to other microparticles manipulating technologies, SBAT has advantages of providing stronger trapping force and deeper penetration depth in tissues, and producing less tissue damage, its potential for in vivo applications has yet been explored. It is worth noting that ultrasound has been used as a diagnostic tool for over 50 years and no known major adverse effects have been observed at the diagnostic energy level. This paper reports the results of an initial attempt to assess the feasibility of single beam acoustic tweezers to trap microparticles in vivo inside of a blood vessel. The acoustic intensity of SBAT under the trapping conditions that were utilized was measured. The mechanical index and thermal index at the focus of acoustic beam were found to be 0.48 and 0.044, respectively, which meet the standard of commercial diagnostic ultrasound system.
Similar to physics involved in optical trapping,1 a steep intensity gradient of the acoustic microbeam coupled with a minimal difference in acoustic impendence between microparticles and the surrounding medium results in a net acoustic radiation force (gradient force) on the particle in moving it towards the beam axis. It was first theoretically and experimentally demonstrated by Lee and Shung.2 Several in vitro applications of single beam acoustic tweezers (SBAT) have been explored. It has been demonstrated to be capable of manipulating a single cell and estimating the deformability of red blood cells and assaying the invasion potential of breast cancer cells.3,4 However, its enormous potentials for in vivo applications have not been explored.
Obviously, technologies like micro-pipette aspiration and atomic force microscopy, which have very short working distance or requires direct contact with the objects to be controlled, are not suitable for the in vivo study. Technologies for noncontact manipulation of microparticles also are available, i.e., laser beam1 and electron beam,5 but they suffer from poor penetration in skin and other human tissues. Additionally, heat generated by the highly focused laser and electron beams may cause tissue damage. Standing surface acoustic wave acoustic tweezers (SSAT)6 has similar advantages as SBAT in possessing stronger trapping force as well as deeper penetration, and producing less tissue damage due to the intrinsic characteristics of sound. However, it requires a pair of parallel or orthogonal transducers, which limits its applications for in vivo study. Therefore, it is highly unlikely that any of those technologies will find in vivo applications. SBAT on the other hand may offer an exciting solution of this problem.
Previous studies7 have already demonstrated that SBAT could trap microparticles under the steady flow condition. It was proposed that SBAT could be integrated with microfluidic device for cell sorting.8 The trapping force generated by SBAT was measured with both a drag force method9 and an acceleration method.10 It was demonstrated that SBAT could generate trapping forces at the nanonewton level, which is much stronger than the trapping force generated by a laser tweezer and electron beam tweezer. Moreover, it was observed that the trapping force generated by SBAT nonlinearly increases with the driving energy.10 To be on the safe side, the driving condition of SBAT was rarely operated above 60% of its maximum.
A number of issues need to be considered in applying SBAT to in vivo study. (1) The size of trapping targets in vivo must be close to or less than the size of red blood cells so that they could pass through capillaries to minimize possible toxicity. (2) In general, the frequency of SBAT should be increased as the size of the targets becomes smaller, resulting in a reduced penetration depth, due to the higher attenuation coefficient of tissue and blood vessel at higher frequency. (3) The deviation and distortion of ultrasound beam introduced by the inhomogeneous nature of blood vessels and tissues may become more severe, and thus degrade the trapping performance.
Needle type and phased array transducers may alleviate these problems. The trapping performance of both types of SBAT was demonstrated previously.11,12 Needle type transducers may be positioned closer to the particles to be trapped or cells inside of blood vessels transcutaneously after piercing through skin and tissues. The acoustic beam generated by phased array transducers could be dynamically focused at different depths and angles; therefore, no mechanical movement of transducer is required. Furthermore, it could refocus acoustic beam after penetrating inhomogeneous tissue. It seems that there is a need to further develop those two types of SBAT as tools directed at manipulating microparticles in vivo.
There are several questions that need to be answered before it can be made a practical tool. Frist of all, it has to be demonstrated that the acoustic beam generated by SBAT could manipulate microparticles or cells after penetrating a blood vessel. Second, acoustic trapping thus far has only been carried out on a flat surface. The morphology of a blood vessel is far from that. It has a curved surface and half enclosed environment. To address those questions, two in vitro experiments were designed and carried out with a traditional type SBAT. For in vivo investigations, biosafety is another issue of paramount concern. Therefore, mechanical index and thermal index of SBAT under the experimental driving conditions were assessed to estimate potential bioeffects on cells and tissue introduced by acoustic beam.
Experiment #1: The purpose of this experiment is to demonstrate the capability of acoustic beam generated by SBAT could trap microparticles with a size at the cell level, after penetrating through blood vessel wall. A rat aorta was harvested by a surgeon at the Health Sciences Campus of University of Southern California. The aorta was stored in Eurocollins solutions at 4 °C for this experiment. The outer diameter of aorta was about 3 mm. The thickness of aorta wall was about 0.8 mm. The trapping action of SBAT was observed with a microscope. Since the rat aorta was not transparent for light, it was cut open and placed on a plastic film as shown in Fig. 1, to allow the visualization of the trapped targets from the other side of vessel wall via a microscope. Even so microparticles under the aorta were still barely observable because the lamp light of the microscope was blocked by the acoustic tweezer and the aorta. As a result, fluorescence imaging was applied to allow better visualization of the trapping action. It was performed using an inverted microscope (IX-71, Olympus, Japan) equipped with a 4× objective, an appropriate filter set (excitation, 535 ± 20 nm; emission, >590 nm), and a CMOS camera (ORCA-Flash2.8, Hamamatsu, Japan). Fluorescent polystyrene microspheres of 3 μm diameter (Fluoresbrite® Yellow green, 3 μm, Polyscience, Inc.) were used as trapping targets. Light from a mercury lamp was delivered to fluorescent polystyrene microspheres through the objective for excitation, after passing through an excitation bandpass filter and a dichroic mirror. Fluorescence emitted from microspheres was then collected by the objective and recorded by the CMOS camera after passing through an emission bandpass filter. A XYZ positioner (SGSP 50, Sigma KOKI Co., Japan) connected with a stage controller (SHOT 204, Sigma KOKI Co., Japan) was employed to control the position of the acoustic tweezer. A traditional SBAT at 40 MHz was designed and fabricated for this experiment. It was driven in a sinusoidal burst mode by a function generator (AFG3251, Tektronix, Anaheim, CA, USA) and then amplified by a 50 dB power amplifier (525LA, ENI, Rochester, USA). The specifications and driving conditions applied in this experiment are summarized in Table. I. The fabrication process of the acoustic tweezer was similar to that described in a previous publication.13
FIG. 1.

Tissue sample and experimental configuration for Experiment #1.
TABLE I.
Specifications, driving conditions, acoustic power, mechanical index, and thermal index of SBAT.
| Specifications | Driving conditions | Acoustic power, MI, and TI | |||
|---|---|---|---|---|---|
| Material | Lithium niobate | Voltage | 22.14 Vpp | Acoustic power (W0), mW | 0.23 |
| Aperture size | 12.5 mm2 | Frequency | 40 MHz | Mechanical index at focus | 0.48 |
| Center frequency | 40 MHz | Pulse repetition frequency | 1 kHz | Thermal index at focus | 0.044 |
| Focal length | 4.0 mm | Duty factor | 1% | ||
| f-number | 1 | ||||
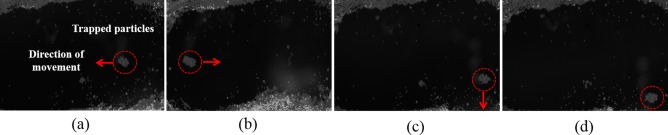
The trapping results are illustrated in Fig. 2. The red dashed dotted line was used to mark the trapped particles and the red arrow was used to indicate the direction of the movement of SBAT. The results show that the trapped microparticles were following the motion of SBAT, demonstrating that the acoustic beam generated by a 40 MHz SBAT could manipulate multiple microparticles of a size at the cell level, after penetrating through a rat aorta.
FIG. 2.
Experiment #2: This experiment was designed to demonstrate the capability of acoustic tweezers to manipulate microparticles on a curve surface. A polyimide tubing which had a similar size to rat aorta (inner diameter: 1.29 mm, outer diameter: 1.48 mm) was used in this experiment to mimic the geometry of a rat aorta. The tubing was filled with distilled water and fluorescent polystyrene beads size of 3 μm diameter (Fluoresbrite Yellow green, 3 μm, Polyscience, Inc.). The fluorescent polystyrene beads were used as trapping targets. The reason for not using blood is that blood is not transparent to light; the visibility of red blood cells in whole blood is very poor under the microscopy. Fluorescence imaging technique was also applied in this experiment to observing the trapping action. The same SBAT and driving conditions used in Experiment #1 were applied in this experiment. The experimental arrangement was also similar to Experiment # 1 (Fig. 1).
As demonstrated in Fig. 3, the polystyrene microbeads close to the focus of acoustic beam were trapped and in the meantime the surrounding microbeads were pushed away. The trapped microbeads were moved by the SBAT inside this tubing. This result demonstrated that SBAT could not only manipulate microparticles on a flat surface, but also on a curved surface, which has geometry similar to a blood vessel.
FIG. 3.

The biological effect of SBAT is a critical issue of concern, before it can be applied to in vivo studies. Mechanical index (MI) and thermal index (TI) have been used for many years to quantify the exposure levels of a medical ultrasound system. They provide quantitative measurements to estimate the risk of adverse ultrasonic effects due to the nonthermal and thermal mechanisms. Since 1993, MI and TI were recommended to be displayed by an ultrasound diagnostic system by US Food and Drug Administration (FDA), and generally accepted as indicators of safety by the international regulatory community.
Mechanical index is defined as
where PNP is the attenuated peak negative pressure of the ultrasound wave at the point of interest, Fc is the center frequency of the ultrasound wave. The attenuation coefficient of soft tissues is assumed to be 0.3 dB cm−1 MHz−1.
Currently, the FDA stipulates that the MI of a diagnostic ultrasound system should not exceed 1.9. However, if there are gas bodies, MI values should be less than 0.4.
Thermal index for soft tissue scanning is defined as
where Wp is the attenuated acoustic power at the point of interest, and Wdeg is the estimated power necessary to raise the tissue equilibrium temperature by 1 °C. TI less than 2 can be used for long exposure times whereas if TI is greater than 2 and up to 6, the exposure time should be limited to less than 30 min.
The data used to calculate MI and TI were measured by a calibrated needle hydrophone of 40 μm diameter (HPM04/1, Precision Acoustics, Dorchester, Dorset, United Kingdom). The measurement protocol followed that described in “Acoustic Output Measurement Standard for Diagnostic Ultrasound Equipment Revision 3 (NEMA UD2–2004)” drawn up by the National Electrical Manufacture Association. The MI, TI, and acoustic power under the driving conditions of above two experiments were calculated and summarized in Table. I. Both of MI and TI meet the standard of FDA. And the trapping force was found to increase nonlinearly with the increase of the driving energy.10 This particular SBAT could be safely driven at a voltage up to 100 Vpp. Therefore, it is possible to further increase the trapping force by increasing the driving energy. Since TI (0.044) is significantly less than the standard required by FDA, only MI was estimated at higher driving energies. The results show that MI increased with the increase of the input voltage, but was independent of the duty factor (Fig. 4).
FIG. 4.
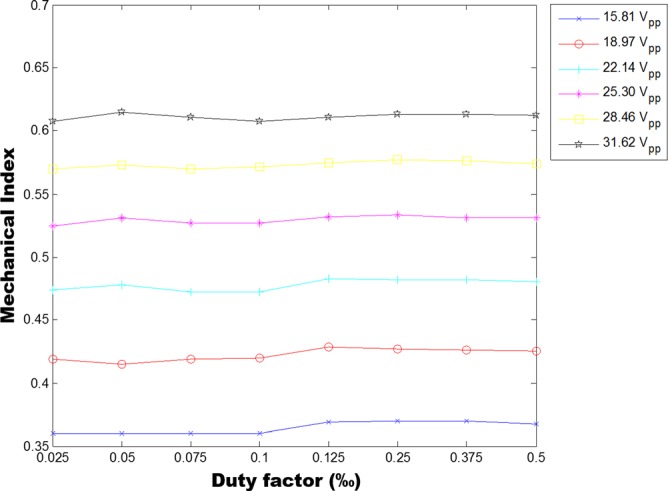
Mechanical index was measured as a function of input voltage to driving SBAT.
The Spatial Peak Temporal Average Intensity (ISPTA) of SBAT was also measured at the focus (Z = 4 mm) two dimensionally. The ISPTA at the focus of acoustic beam (10.33 W/cm2) is much higher than the value recommended by FDA for diagnostic scanners (700 mW/cm2). ISPTA dramatically drops, as the measurement point is moved away from the focus. As it is shown in Fig. 5, the area of ISPTA above 700 mW/cm2 is inside of a tiny circle (R = 52 μm) around the focus of acoustic beam.
FIG. 5.
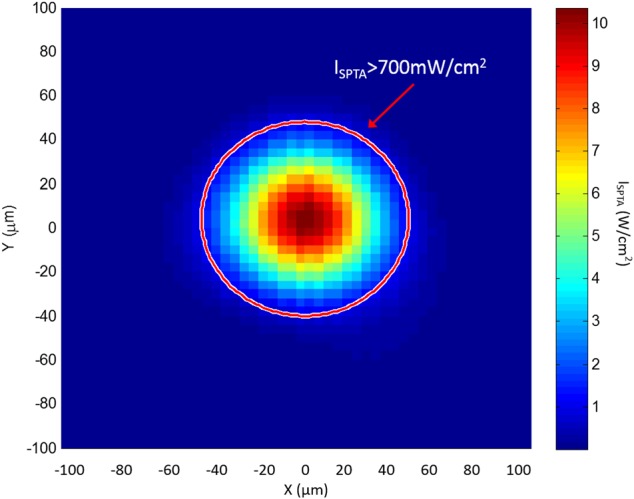
Spatial Peak Temporal Average Intensity (ISPTA) at the focal plane of a 40 MHz SBAT (focal length = 4 mm). The red circle indicates the area of ISPTA is larger than 700 mw/cm2.
Here it should be noted that the actual pressure value at the focus could be even higher, restricted by the resolution of hydrophone. More accurate results could be obtained by applying a spatial averaging correction method.14 Furthermore, MI and TI were designed for commercial ultrasound diagnostic system available in the market for the frequency range from 1–20 MHz. Although there are still no general guidelines for the safe use high frequency ultrasound, it is known that ultrasound mechanical effect is inversely proportional to frequency. The likelihood of cavitation at frequencies higher than 20 MHz is small at the intensity level used in this study. Nevertheless the bioeffects of SBAT should be studied carefully in the future in cells and animals.
In a previous study,15 the viability of human umbilical vein endothelial cells (HUVECs) was tested after 5, 10, and 20 min exposure to the high-frequency acoustic beam at an intensity level similar to the present study. There is no significant change in viability of HUVECs after those exposures. Besides, pregnant mice were exposed to an acoustic beam generated by an Ultrasound biomicroscopy (UBM) at 40 MHz with a free field ISPTA of 11.9 W/cm2. No significant bioeffects on the adult mice were observed but minimal bioeffects on growth and malformations of their offspring were found.16 It appears that it is prudent to study carefully the bioeffects of acoustic beam at high frequency and high acoustic intensity before it is used for in vivo studies.
In summary, the acoustic beam generated by a traditional type SBAT has been shown to be capable of manipulating microparticles of a size at the cell level, after it penetrating through a blood vessel of a wall thickness about 0.8 mm. In addition, the feasibility of SBAT to trap microparticles on a curved surface was demonstrated, which had geometry similar to a blood vessel. The trapping force could be further increased by increasing the driving energy in these experiments, while maintaining MI and TI in reasonable ranges. It is highly possible that the SBAT can be applied to in vivo studies involving small animal like rat and mice following additional development. The data presented in this paper represent an important step toward reaching this goal.
Acknowledgments
This work has been supported by NIH Grant Nos. R01-EB12058 and P41-EB02182 and a Provost Postdoctoral Scholar Grant. Special thanks to Dr. Hong and Young-Kwon for providing the biological tissue sample for this study.
References
- 1.Ashkin A., Dziedzic J. M., and Yamane T., Nature 330(6150), 769 (1987). 10.1038/330769a0 [DOI] [PubMed] [Google Scholar]
- 2.Lee J. and Shung K. K., J Acoust Soc Am 120(2), 1084 (2006); 10.1121/1.2216899 [DOI] [PubMed] [Google Scholar]; Lee J., Ha K., and Shung K. K., J Acoust Soc Am 117(5), 3273 (2005). 10.1121/1.1886387 [DOI] [PubMed] [Google Scholar]
- 3.Hwang J. Y., Lee N. S., Lee C., Lam K. H., Kim H. H., Woo J., Lin M. Y., Kisler K., Choi H. J., Zhou Q. F., Chow R. H., and Shung K. K., Biotechnol. Bioeng. 110(10), 2697 (2013). 10.1002/bit.24923 [DOI] [PMC free article] [PubMed] [Google Scholar]
- 4.Li Y., Hwang J. Y., Shung K. K., and Lee J., Acoust. Today 9(4), 10 (2013). 10.1121/1.4826996 [DOI] [Google Scholar]
- 5.Chiou P. Yu., Ohta A. T., and Wu M. C., Nature 436(7049), 370 (2005). 10.1038/nature03831 [DOI] [PubMed] [Google Scholar]
- 6.Shi J. J., Ahmed D., Mao X., Lin S. C. S., Lawit A., and Huang T. J., Lab Chip 9(20), 2890 (2009). 10.1039/b910595f [DOI] [PubMed] [Google Scholar]
- 7.Jeong J. S., Lee J. W., Lee C. Y., Teh S. Y., Lee A., and Shung K. K., Biomed. Microdevices 13(4), 779 (2011). 10.1007/s10544-011-9548-0 [DOI] [PMC free article] [PubMed] [Google Scholar]
- 8.Lee C., Lee J., Kim H. H., Teh S. Y., Lee A., Chung I. Y., Park J. Y., and Shung K. K., Lab Chip 12(15), 2736 (2012). 10.1039/c2lc21123h [DOI] [PMC free article] [PubMed] [Google Scholar]
- 9.Lee J., Jeong J. S., and Shung K. K., Ultrasonics 53(1), 249 (2013). 10.1016/j.ultras.2012.06.008 [DOI] [PMC free article] [PubMed] [Google Scholar]
- 10.Li Y., Lee C., Lam K. Ho., and Shung K. K., Appl. Phys. Lett. 102(8), 84102 (2013). 10.1063/1.4793654 [DOI] [PMC free article] [PubMed] [Google Scholar]
- 11.Hsu H. S., Zheng F., Li Y., Lee C., Zhou Q., and Shung K. K., Appl. Phys. Lett. 101(2), 24105 (2012). 10.1063/1.4736731 [DOI] [PMC free article] [PubMed] [Google Scholar]
- 12.Zheng F., Li Y., Hsu H. S., Liu C., Chiu C. T., Lee C., Kim H. H., and Shung K. K., Appl. Phys. Lett. 101(21), 214104 (2012). 10.1063/1.4766912 [DOI] [PMC free article] [PubMed] [Google Scholar]
- 13.Lam K. H., Hsu H. S., Li Y., Lee C., Lin A., Zhou Q., Kim E. S., and Shung K. K., Biotechnol. Bioeng. 110(3), 881 (2013). 10.1002/bit.24735 [DOI] [PMC free article] [PubMed] [Google Scholar]
- 14.Radulescu E. G., Lewin P. A., Goldstein A., and Nowicki A., IEEE Trans. Ultrason. Ferroelectr. Freq. Control 48(6), 1575 (2001). 10.1109/58.971709 [DOI] [PubMed] [Google Scholar]
- 15.Hwang J. Y., Lim H. G., Yoon C. W., Lam K. H., Yoon S., Lee C., Chiu C. T., Kang B. J., Kim H. H., and Shung K. K., Ultrasound Med. Biol. 40(9), 2172 (2014). 10.1016/j.ultrasmedbio.2014.03.018 [DOI] [PMC free article] [PubMed] [Google Scholar]
- 16.Brown A. S., Reid A. D., Leamen L., Cucevic V., and Foster F. S., Ultrasound Med. Biol. 30(9), 1223 (2004). 10.1016/j.ultrasmedbio.2004.07.020 [DOI] [PubMed] [Google Scholar]