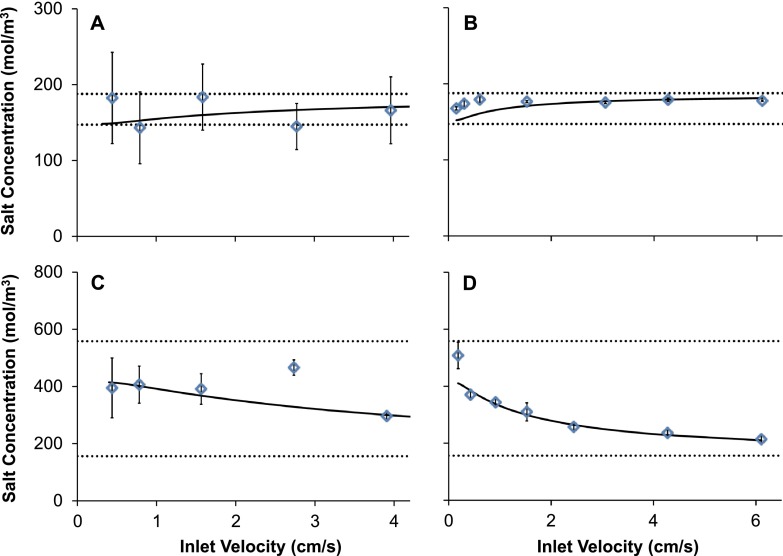
FIG. 4.
Sodium chloride concentration in the RBC stream effluent. (a) and (b) show results for RBCs in 10% glycerol using the 50 and 130 μm device, respectively. (c) and (d) show results for frozen-thawed RBCs in 40% glycerol using the 50 and 130 μm device, respectively. Solid lines show predicted sodium chloride concentrations in the RBC stream effluent and dotted lines show the inlet concentrations in the RBC and wash streams.

