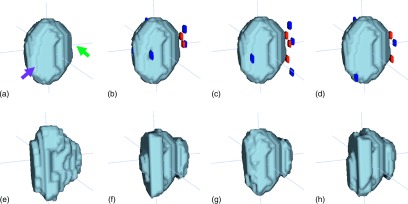
FIG. 3.

Interactive segmentation results with different user interactions conducted at different time periods. (a) and (e) show automatic segmentation result and ground truth, respectively. Here, the front left part of the automatic segmentation result is over-segmented (left arrow), while the right part is under-segmented (right arrow). (b), (c), and (d) show three different user interactions, respectively. (f), (g), and (h) show the corresponding interactive segmentation results of (b), (c), and (d).
