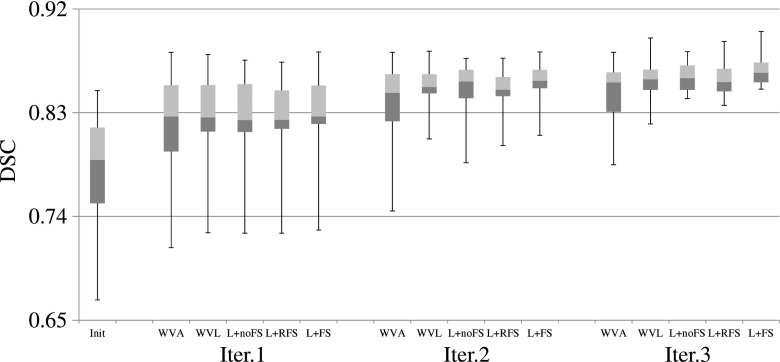
FIG. 5.
DSC scores of the training based methods for the 30 testing images, using the second user interactions. The three horizontal lines of the box represent the upper quartile (75%), median (50%), and lower quartile (25%), while the whiskers indicate the min and max DSC scores. Note that, in the figure, L denotes LapRLS.

