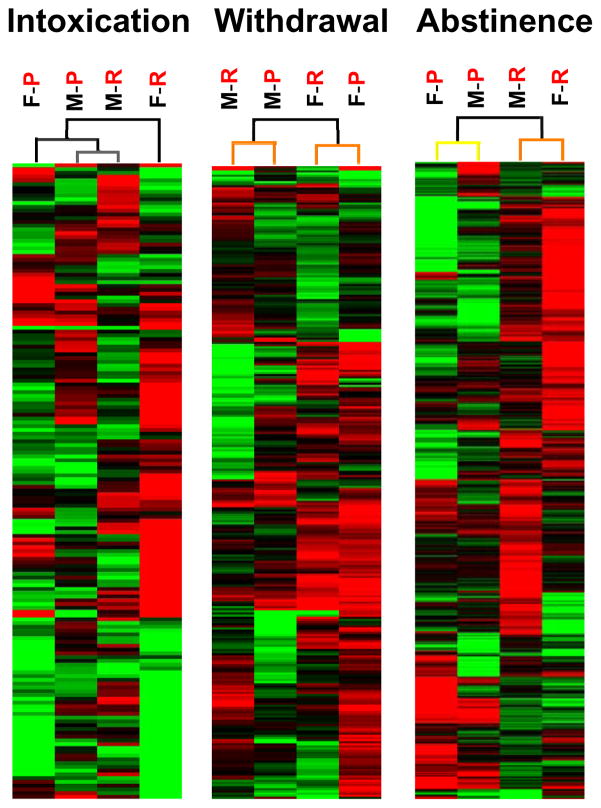
Figure 1.
Hierarchical clustering (HCL) at each stage of addiction shows distinct influence of sex vs. line at different stages. Characterization of structural hierarchy for genes that were significantly regulated after chronic ethanol treatment. During the early stages of intoxication and withdrawal, sex is the most important influence on expression differences while during abstinence, selected phenotype/genotype was the strongest influence on expression differences. Boot-strap analysis (100 iterations) of clustering is indicated in the color of the lines in the dendrogram shown above the heat map; with black indicating 100% recovery, grey indicating 90–100% recovery, yellow indicating 60–70% recovery, and orange indicating 50–60% recovery. Each column represents combined analysis from 8 arrays with two mice per array. Gene expression is indicated by color (green (up-regulated), or red (down-regulated), with the intensity of the color proportional to the intensity of regulation. F, female. M, male. P, WSP. R, WSR.

