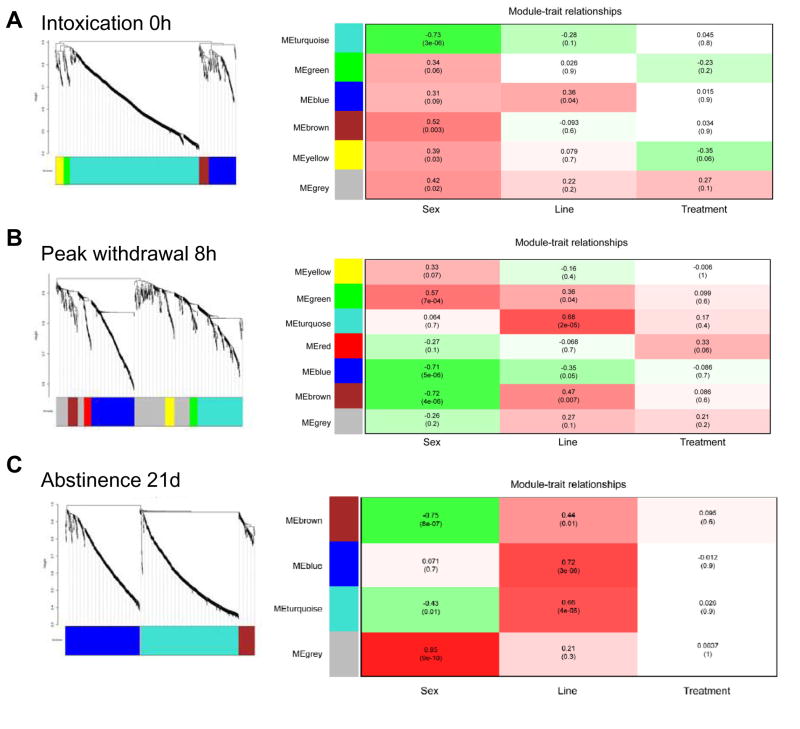
Figure 3.
WGCNA analysis at each stage of addition identified distinct modules of coexpressed genes for sex and for line differences. A. Intoxication (0 h). B. Peak withdrawal hyperexcitability (8 h). C. Abstinence (21 d). Significant association between modules and the traits of sex and line were observed, but treatment effects (the consequences of chronic ethanol exposure) were modest in the combined datasets. In the Module-Trait relationships table, red color indicates higher expression in females, higher expression in WSR, and higher expression with ethanol while green indicates higher expression in males, higher expression in WSP, and lower expression with ethanol. For each block in the module-trait relationship table, values represent Pearson’s correlation coefficients, while numbers in parentheses below indicate the p-value for the significance of the relationship.

