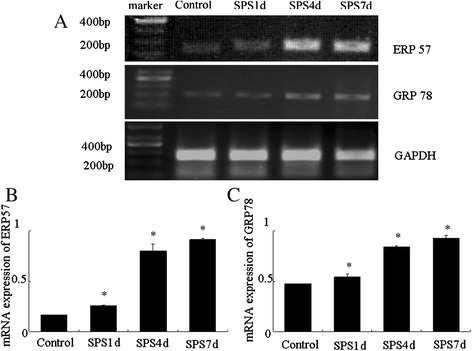
Figure 6.

Difference in GRP78 and ERP57 mRNA levels in control rats and SPS rats detected by RT-PCR. Representative gel pattern of cDNA were shown in (A), and relative amount of GRP78 and ERP57 mRNA were shown in (B) and (C), respectively. Statistical analysis was carried out by Tukey test. *P < 0.05 versus control.
