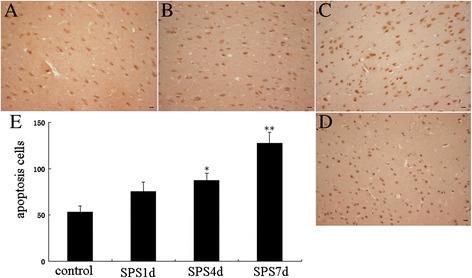
Figure 7.

Apoptosis detected by TUNEL assays. The Representative images were shown in (A-D, magnification × 400), A: the control group; B: the SPS1d group; C: the SPS4d group; D: the SPS7d group; and E shows quantification of apoptosis cells. Statistical analysis was carried out by Tukey test. *P < 0.05 versus control, **P < 0.05 versus control.
