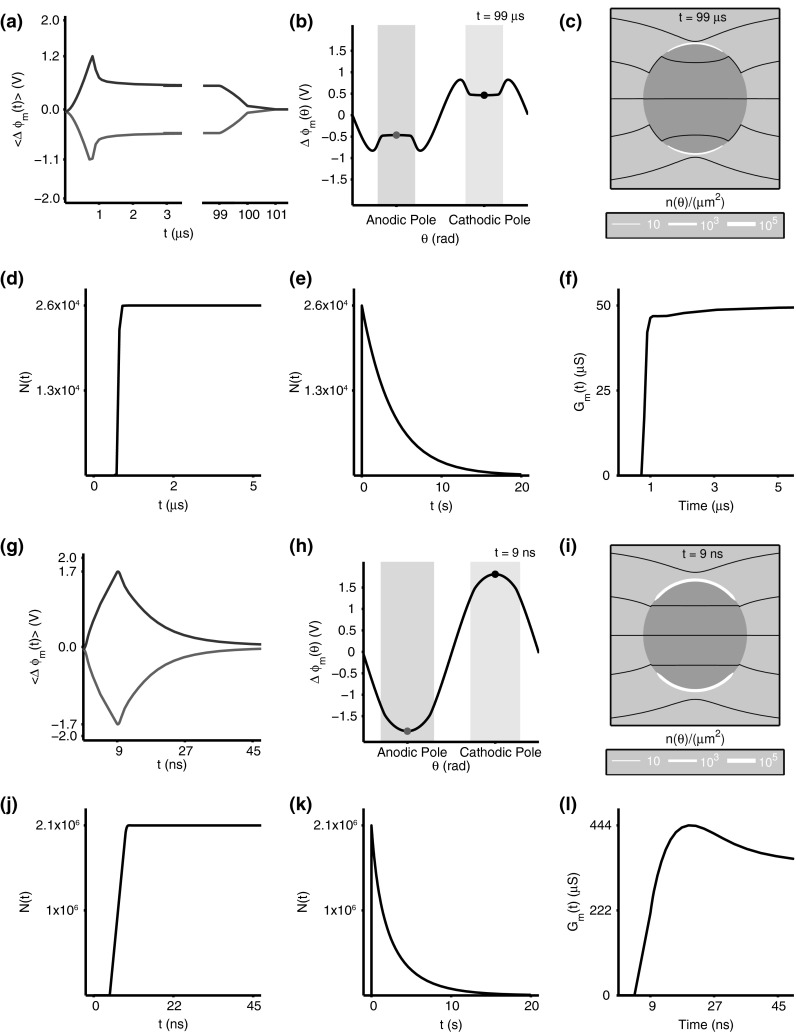
Fig. 2.

Electrical and poration behavior for a 1.5 kV/cm, pulse (a–f) and a 40 kV/cm, 10 ns pulse (g–l). Average transmembrane voltage, is spatially averaged over the polar quadrants. Angular transmembrane voltage, at the end of pulse maximum shows the spatial heterogeneity in the electrical response across the membrane. Light red and black shaded regions represent electroporated regions of the membrane. Similarly, pore density, , at the end of pulse maximum shows the spatial extent of electroporation. The total number of pores, , rises after REB, and decreases exponentially after the pulse in accordance with pore lifetime, . Similarly, the total membrane conductance, , increases with pore creation and expansion (Color figure online)
