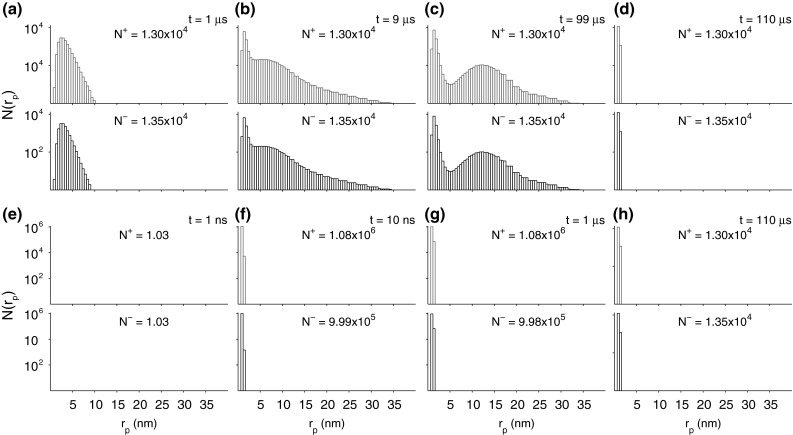
Fig. 3.

Pore histograms show the distribution of pore radii, , at various times in response to the 1.5 kV/cm, pulse (a–d) and the 40 kV/cm, 10 ns pulse (e–h). The maximum pore radius , but the display has been truncated to 40 nm in consideration of the maximum pore radii observed
