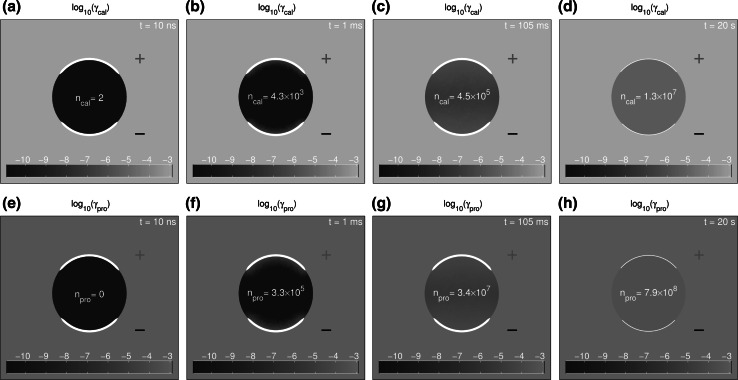
Fig. 5.
The logarithm of calcein and propidium concentrations, and , is shown at t = 10 ns (a, e), t = 1 ms (b, f), t = 105 ms (c, g), and t = 20 s (d, h) for the 40 kV/cm, 10 ns pulse. The total intracellular amounts of each solute are displayed inside the cell. Red ‘+’ and black ‘−’ indicate the anodic and cathodic sides of the system, respectively. Insignificant amounts of both calcein and propidium are internalized during the pulse (a, e). However, the large number of pores created allows for much greater amounts of post pulse diffusion compared to the pulse (Color figure online)

