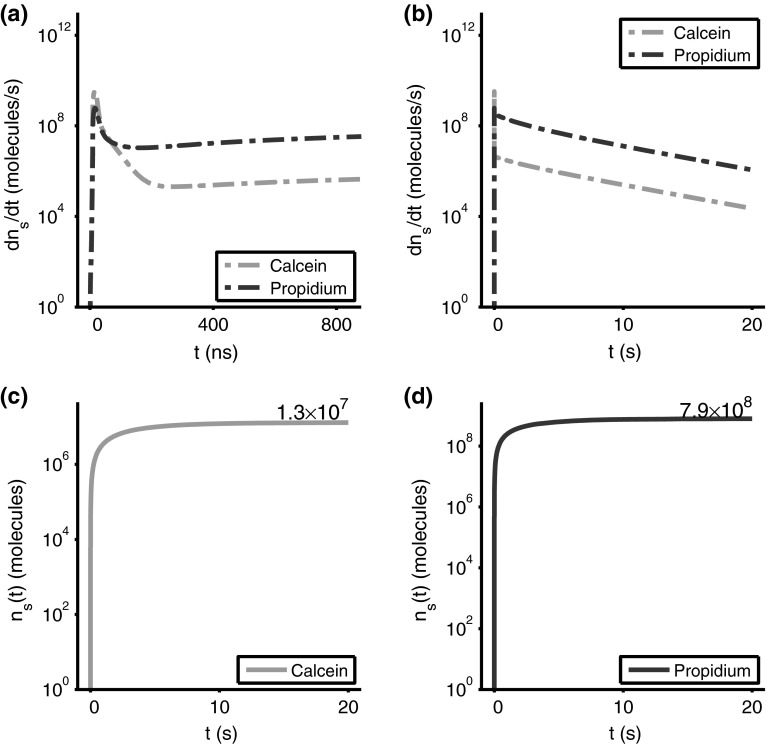
Fig. 7.
Electrodiffusive transport rates of propidium and calcein, , into the cell for a 40 kV/cm, 10 ns pulse (a, b). Cumulative solute influx, (c, d) shows the total amount of solute inside the cell as a function of time. During the 40 kV/cm, 10 ns pulse, 1.5 molecules of calcein and 0.17 molecules of propidium are transported into the cell. After the 10 ns pulse, molecules of calcein and molecules of propidium are transported into the cell

