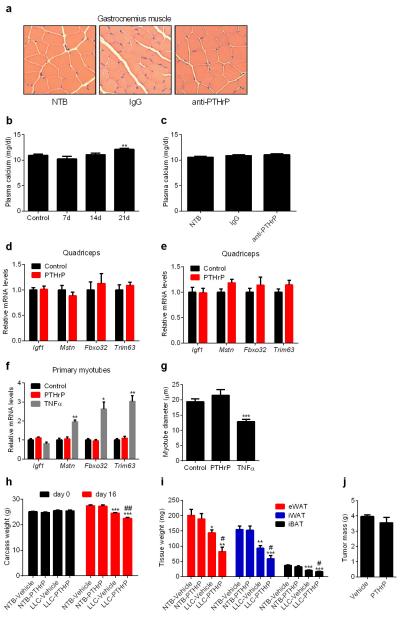
Extended Data Figure 10. LLC tumor-bearing mice do not display hypercalcemia and PTHrP treatment alone does not induce expression of muscle atrophy-related genes but exacerbates cachexia in the LLC tumor-bearing mice.
a, H&E staining of representative cross sectional area of gastrocnemius muscles from the experiment described in Fig. 4b-g. b-c, Plasma calcium was measured in experiments described in Fig 4a and 4b-g. d-e, mRNA levels in quadriceps muscles from the experiment described in Extended Data Fig. 6c-d were measured (n = 5 for the control group and 7 for the PTHrP group). f-g, Primary myotubes were treated with TNFα or PTHrP (100 ng/ml each) for 2hr to test gene expression by RT-qPCR or24 hr to measure myotube diameter (n = 3). Values are means ± SEM. Statistics by two-tailed t test. *P < 0.05, **P < 0.005, ***P < 0.0005 compared with the control group. h-j, Mice inoculated with LLC cells were sacrificed after receiving daily injections of PTHrP (1 mg/kg body weight) between days 10-16 (n = 5 for the LLC-Vehicle group and 6 for the other groups). Carcass weight was measured by subtracting the tumor weight from the total weight (h). Fat tissues (i) and tumors (j) were dissected and weighed. Values are means ± SEM. Statistics by two-tailed t-test. (*) refers to differences compared to the NTB-Vehicle group. (#) refers to differences between the LLC groups. *P < 0.05, **P < 0.005, ***P < 0.0005, #P < 0.05, ##P < 0.005.

