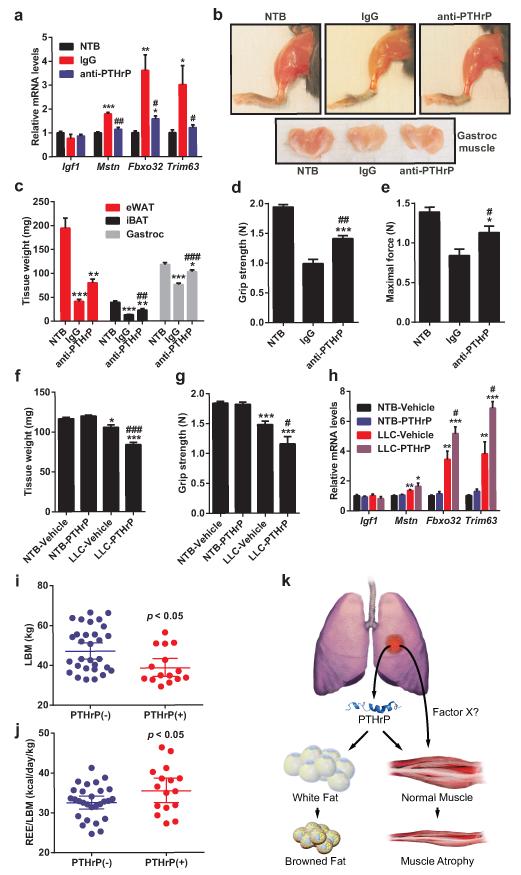
Figure 5. PTHrP is associated with wasting of lean body mass in cachectic mice and humans.
a, mRNA levels in gastrocnemius muscle from the experiment described in Fig. 4b-g. b-e, Mice inoculated with LLC cells received IgG or anti-PTHrP (10 mg/kg body weight) every 3 days from day 6 to day 21-22 (n = 5 for the anti-PTHrP group and 6 for the other groups). Representative images of hindlimb and gastrocnemius muscles are shown (b). Fat and muscle tissues were weighed (c). Muscle function was analyzed by grip strength (d) and in situ contraction (e). f-h, Mice inoculated with LLC cells were sacrificed after receiving daily injections of PTHrP (1 mg/kg body weight) between days 10-16 (n = 5 for the LLC-Vehicle group and 6 for the other groups). Gastrocnemius muscle weight (f) and grip strength (g) were measured. mRNA levels in gastrocnemius muscle were determined by RT-qPCR (h). i-j, LBMand REE/LBM of the PTHrP(+) and PTHrP(−) patients were compared. k. A model for PTHrP action in cancer cachexia. Values are means ± SEM. Statistics by two-tailed t-test. (*) refers to differences compared to the NTB groups. (#) refers to differences between either the IgG and anti-PTHrP groups or the LLC-Vehicle and LLC-PTHrP groups. *P < 0.05, **P < 0.005, ***P < 0.0005, #P < 0.05, ##P < 0.005, ###P < 0.0005.

