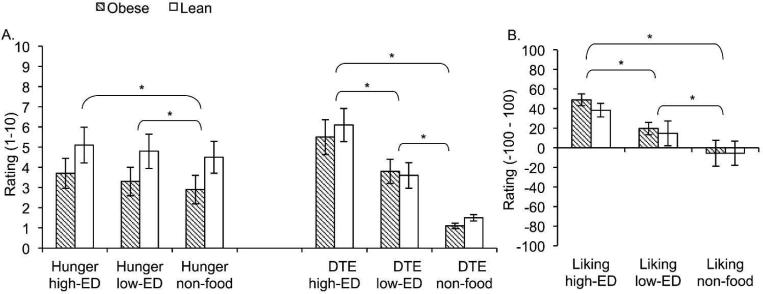
Figure 1.
A. Bars represent hunger and desire to eat ratings for all subjects following presentation of high-ED, low-ED and non-food cues. Asterisks represent significant difference based on post;hoc t-tests (p<0.05). B. Bars represent liking ratings for all subjects following presentation of high-ED, low-ED and non;food cues. Asterisks represent significant difference based on post-hoc t-tests (p<0.05).

