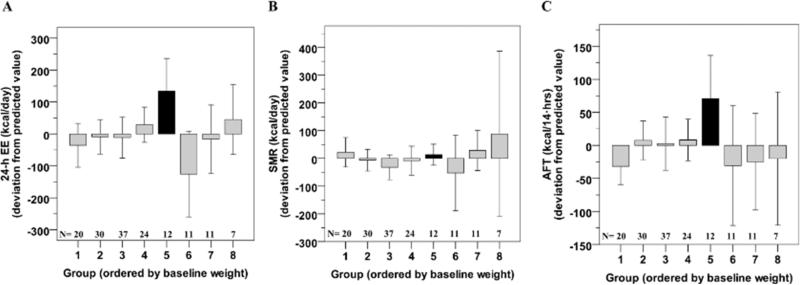
Figure 2.
Twenty-four hour energy expenditure (EE, Panel A), sleeping EE (SMR, Panel B) and awake and fed thermogenesis (AFT, Panel C) in each group as identified by latent class growth analysis of body weight. 24-h EE and SMR measures are calculated after adjustment for age, gender, fat mass and fat free mass while AFT is calculated after adjustment for age, gender, % body fat, fat free mass and fasting glucose concentration. Error bars represent 95% confidence interval of the mean of each group.

