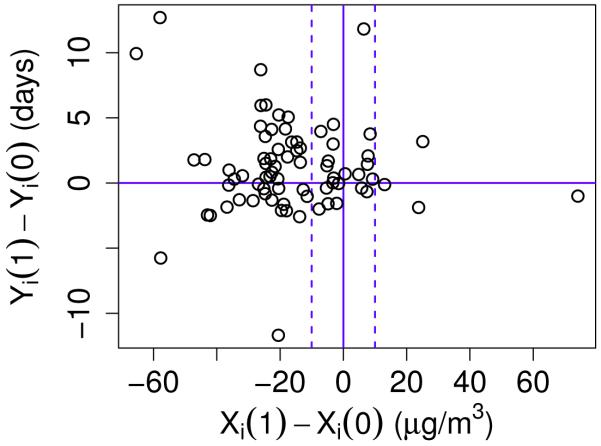
Figure 2.
Plot of the estimated difference in the SFD potential outcomes between treatment and control case, Yi (1) − Yi (0), versus the estimated difference in the PM potential outcomes between treatment and control case, Xi (1) − Xi (0), for each individual i in trial. The solid vertical line denotes where Xi (0) = Xi (1). The left dashed line marks where Xi (1) − Xi (0) = −10 and the right dashed line marks where Xi (1) − Xi (0) = 10. The solid horizontal line marks where Yi (1) − Yi(0) = 0.

