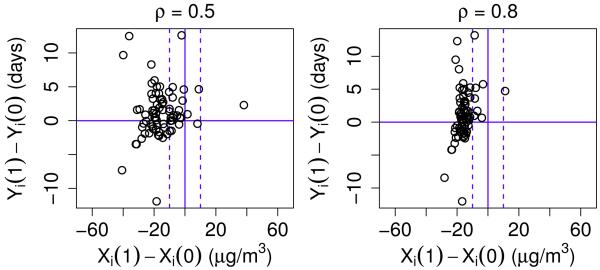
Figure 3.
Plots of the estimated difference in the SFD potential outcomes between the treatment and control cases, Yi (1) − Yi (0), versus the estimated difference in the PM potential outcomes between the treatment and control cases, Xi (1) − Xi (0), for each individual i in trial when ρ = 0.5 (left plot) and ρ = 0.8 (right plot). In each plot, the solid vertical line denotes where Xi (0) = Xi (1). The left dashed line marks where Xi (1) − Xi (0) = −10 and the right dashed line marks where Xi (1) − Xi (0) = 10. The solid horizontal line marks where Yi (1) − Yi (0) = 0.

