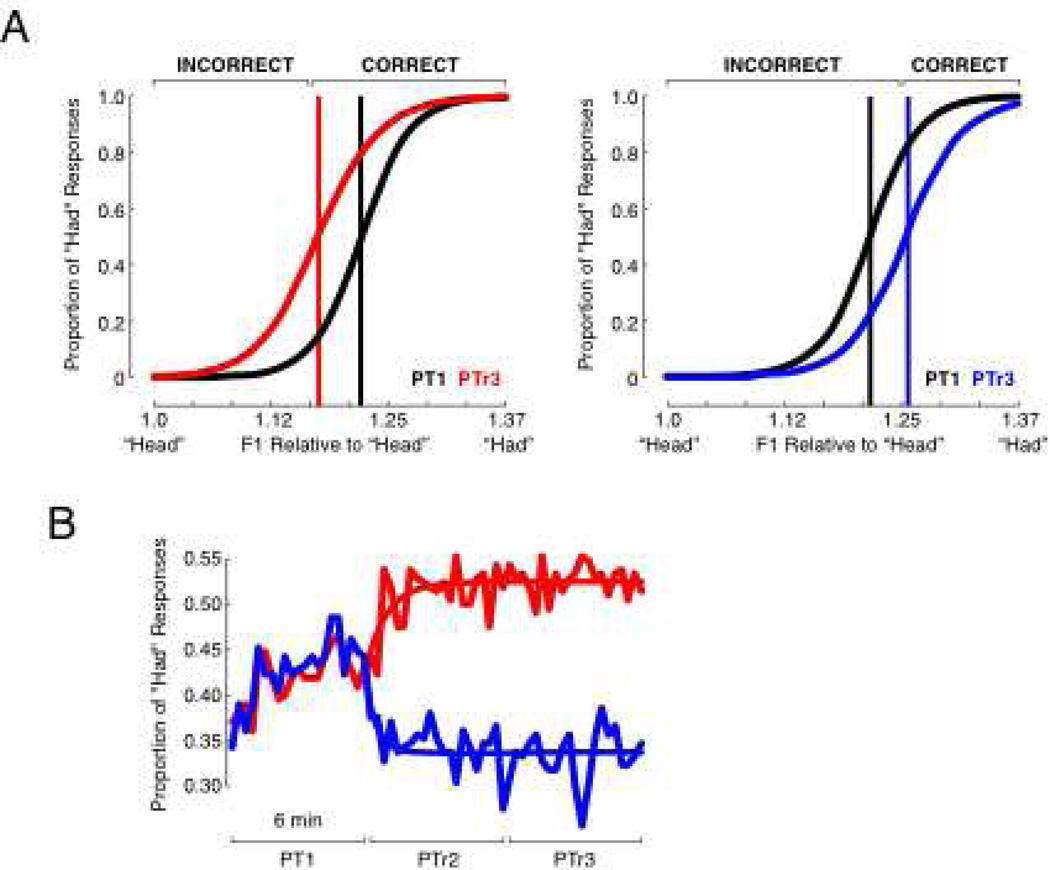
Figure 2.
Perceptual Training Caused a Change in Response (A) Feedback based on the solid colored lines moved the psychometric function from the black curves to the colored curves. The black lines show the initial perceptual boundary; the colored lines show the perceptual boundary following training. Perceptual boundaries were calculated in units of F1 relative to stimulus 1 (“head”). “CORRECT/INCORRECT” feedback refers to a “had” response, in this case. The black psychometric functions are based on responses from the first perceptual test (PT1). The colored psychometric functions are based on responses from the third perceptual test (PTr3), which included feedback. (B) The colored lines join points that represent the average of 10 perceptual responses. Each perceptual test took about 6 minutes. Perceptual training caused a change in the proportion of “had” responses.

